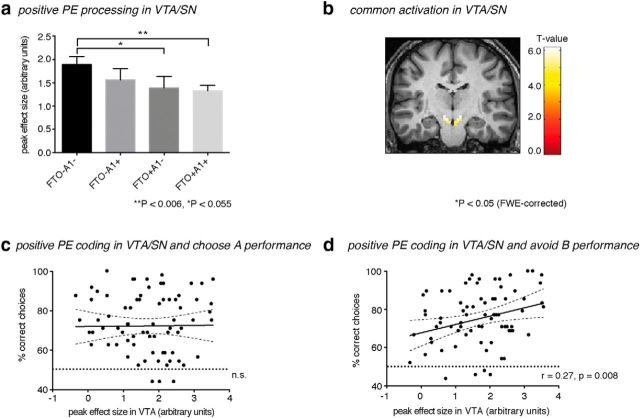
Figure 2.
a, Differences of VTA/SN peak activation in response to positive PEs with regard to the interaction of FTO and ANKK1 gene variants. Values are mean ± SEM. b, Positive PE responses within the VTA/SN VOI (Y = −18), p < 0.05 (FWE-corrected). VTA/SN peak activation to positive PEs correlated with correct choices on (c) “choose A” and (d) “avoid B” trials. Dashed lines indicate the 95% CI for the linear regression (solid line).

