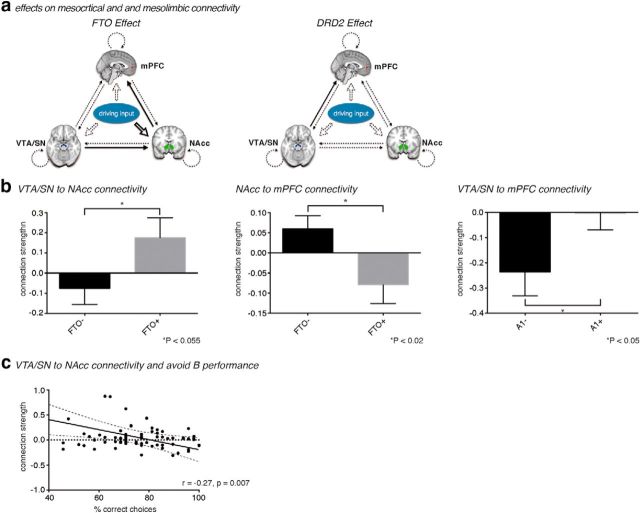
Figure 3.
a, Basic layout of a DCM for investigating modulation of reward-responsive regions by the FTO gene variant and the ANKK1 gene variant. Solid connections indicate connections, which are significantly (p < 0.05) altered by genetic status. Dotted connections do not show a significant genetic effect. b, Average strengths of the connection from VTA/SN to NAcc (left) and from NAcc to mPFC (middle) under both FTO gene variants, as well as from VTA/SN to mPFC (right) relative to groups defined by ANKK1 genotype. Values are mean ± SEM. c, Correlation between connection strength from VTA/SN to NAcc and performance of avoidance learning (percentage correct on “avoid B” trials). Dashed lines indicate the 95% CI for the linear regression (solid line).

