Figure 1.

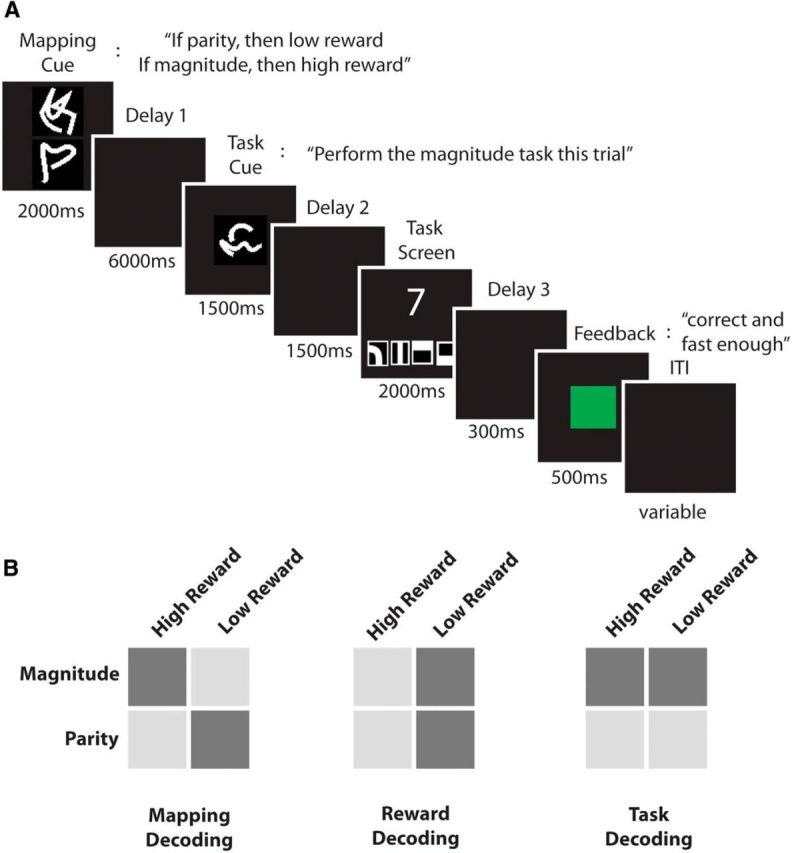
A, Experimental paradigm. One example trial is shown. First, subjects were presented with a mapping cue (2000 ms) that indicated the current association of tasks and rewards. In this trial, parity is associated with a low reward and magnitude is associated with a high reward. After a long delay (delay 1, 6000 ms) subjects were presented with a task cue (1500 ms) indicating which task is to be performed this trial. Note that only by combining information from both cues could subjects determine the current reward condition, in this case a high reward. Before the onset of the task cue, subjects could neither prepare the execution of the instructed task nor could they expect a high or a low reward, leaving only the mapping information to be represented before the task cue onset. After a second delay (delay 2, 1500 ms) the task screen was presented (2000 ms). A single digit was shown together with four response symbols (from left to right: odd, even, larger than 5, and smaller than 5), and subjects were instructed to press the correct button as quickly and accurately as possible. After a third short delay (delay 3, 300 ms), subjects received a reward feedback (500 ms), indicating whether they were correct and fast enough to receive a reward (green for high reward, yellow for low reward), were correct but too slow to receive a reward (magenta), were wrong (red), or did not press any button (red). After a variable intertrial interval (ITI, 2000–7000 ms), the next trial started. B, Analysis overview. Depicted are the three main MVPAs performed in this experiment. In the task–reward mapping analysis (left), task–reward mapping 1 (light gray) was contrasted with task–reward mapping 2 (dark gray). In the reward analysis (middle), the high-reward (light gray) and low-reward (dark gray) conditions were contrasted. In the task analysis (right), the parity task (light gray) was contrasted with the magnitude task (dark gray). In all analyses, we used cross-classification across visual cues to decorrelate the conditions of interest from the visual identity of the cues presented to the subjects.
