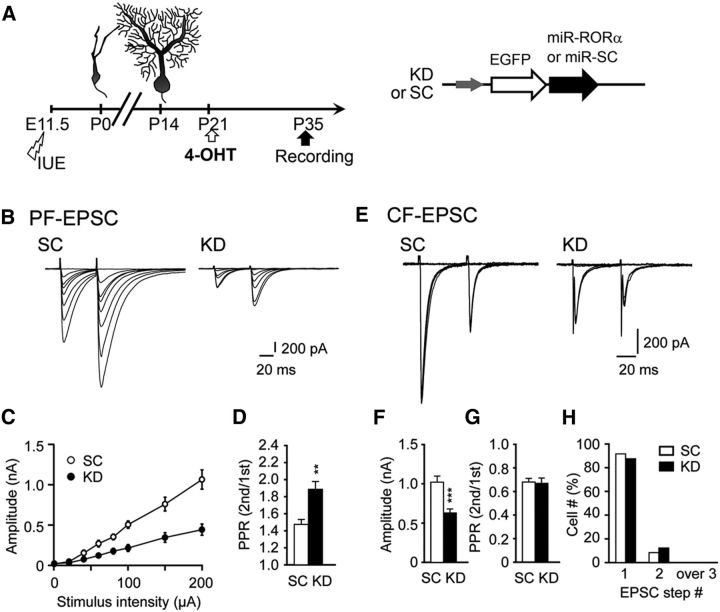
Figure 10.
Knock-down of RORα impairs synaptic functions, but not innervation patterns, in mature PCs. A, Schematic diagram of the experimental procedure. The expression of miR-SC (SC) or miR-RORα (KD) was induced by 4-OHT at P21 and whole-cell patch-clamp recordings were performed from PCs in cerebellar slices at P35. B–D. PF-EPSCs recorded from PCs clamped at −80 mV. Representative PF-EPSCs in PCs expressing miR-SC and miR-RORα at various stimulus intensities (B). Shown is the input–output relationship of PF-EPSCs (C, n = 9 cells for SC and n = 12 cells for KD, 3 mice each). D, Paired-pulse ratio (PPR) of PF-EPSCs at an interstimulus interval (ISI) of 50 ms (n = 22 cells for SC and n = 20 cells for KD, 3 mice each; **p = 0.003 by the Mann–Whitney U test). The PPR is defined as the amplitude of the second EPSC divided by that of the first EPSC. Error bars indicate SEM. E–H, CF-EPSCs recorded from PCs clamped at −10 mV. E, Representative CF-EPSCs in PCs expressing miR-SC and miR-RORα at various stimulus intensities. F, G, Histograms showing the mean amplitude (F, ***p = 0.0001 by the Mann–Whitney U test) and the PPR of CF-EPSCs (G; at ISI = 50 ms, p = 0.90 by the Mann–Whitney U test). Error bars indicate SEM. H, Percentage of PCs innervated by single and multiple CFs. The number of CF-EPSCs induced by different stimuli thresholds (0–200 μA) was counted. n = 17 cells from 3 mice for SC and n = 35 cells from 4 mice for KD (E–H).

