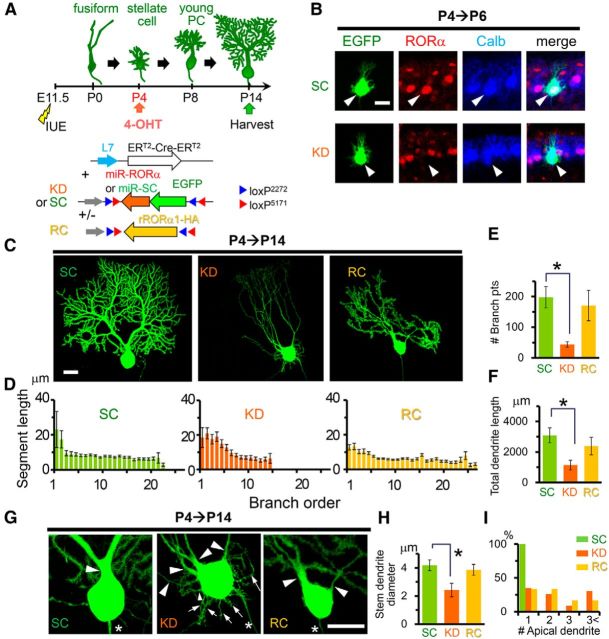
Figure 4.
Knock-down of RORα from the stellate cell stage impairs dendritic pruning and branching. A, Schematic diagram of the experimental procedure. The mice were electroporated at E11.5 and the expression of EGFP-miR-RORα (KD) or scrambled miR (SC) was induced by 4-OHT injection at P4. In the rescue (RC) experiments, the expression of rRORα1-HA was also induced. B, Application of 4-OHT at P4 induces a reduction in endogenous RORα in PCs expressing miR-RORα at P6. Immunofluorescent signals for endogenous RORα (red) and a PC marker calbindin (Calb, blue) are shown. The arrowheads indicate transfected PCs (EGFP, green). Scale bar, 20 μm. C, Dendritic branching of PCs expressing miR-SC (SC), miR-RORα (KD), or miR-RORα plus RORα1-HA (RC) at P14. Representative stacked images of EGFP fluorescence are shown. Scale bar, 20 μm. D, Length of the dendritic segment at each branch order. The bars represent the mean ± SEM segment lengths of n = 4 cells from 2 mice (SC), n = 6 cells from 3 mice (KD), and n = 6 cells from 2 mice (RC). E, Number of dendritic branch points. The bars represent the mean ± SEM branch points. n = 4 cells from 2 mice (SC), n = 6 cells from 3 mice (KD), and n = 6 cells from 2 mice (RC), *p = 0.0344 (ANOVA followed by Tukey's test). F, Total dendritic length per single PCs. The bars represent the mean ± SEM total dendritic length. n = 4 cells from 2 mice (SC), n = 6 cells from 3 mice (KD), and n = 6 cells from 2 mice (RC), *p = 0.0404 (ANOVA followed by Tukey's test). G, Enlarged images of the somata shown in C. Arrowheads and arrows indicate apical and perisomatic dendrites, respectively. Asterisks indicate axons. Scale bar, 20 μm. H, Diameters of the thickest primary dendrites. Bars represent the mean ± SEM diameters of the independent experiments. n = 6 cells from 2 mice (SC), n = 8 cells from 3 mice (KD), and n = 9 cells from 3 mice (RC), *p = 0.0328 (ANOVA followed by Tukey's test). I, Number of apical primary dendrites per single PCs. The percentages of PCs showing 1, 2, 3, and more apical primary dendrites are shown. n = 16 cells from 3 mice (SC), n = 23 cells from 7 mice (KD), n = 22 cells from 4 mice (RC), ***p = 1.14 × 10⁻⁴ (SC vs KD) and 1.50 × 10⁻⁵ (SC vs Rescue) (χ2 test followed by Bonferroni's correction).

