Figure 7.
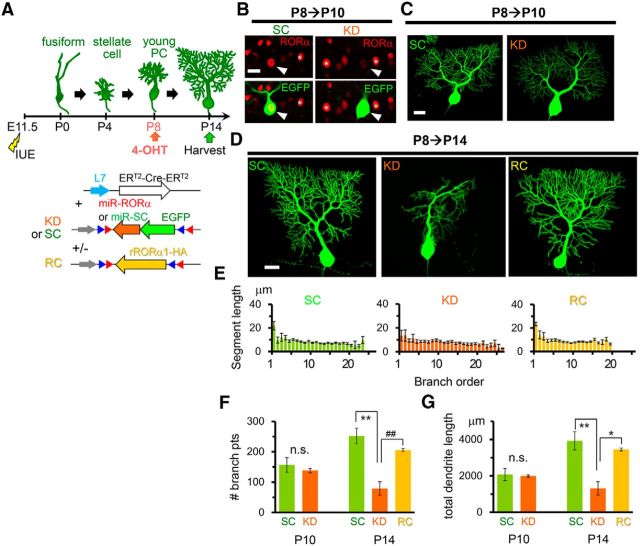
Knock-down of RORα after the young PC stage impairs the formation and maintenance of dendrites. A, Schematic diagram of the experimental procedure. The expression of miR-SC (SC), miR-RORα (KD), and miR-RORα plus rRORα1-HA (rescue: RC) was induced by 4-OHT at P8. B, Application of 4-OHT at P8 induces the reduction of endogenous RORα in PCs expressing miR-RORα at P10. Immunofluorescent signals for endogenous RORα (red) were examined in EGFP-positive PCs (green, arrowheads). The asterisks indicate neighboring untransfected PCs. Scale bar, 20 μm. C, Gross dendritic arborization of PCs expressing miR-SC and miR-RORα is indistinguishable at P10. Representative stacked EGFP images of PCs are shown. Scale bar, 20 μm. D, Knock-down of RORα from P8 induces atrophic PC dendrites at P14. Representative stacked EGFP images of PCs expressing miR-SC (SC), miR-RORα (KD), and miR-RORα plus rRORα1-HA (RC) are shown. Scale bar, 20 μm. E, Length of the dendritic segment of PCs at each branch order at P14. Bars represent the mean ± SEM segment lengths of n = 3 cells from 2 mice (SC and RC) or n = 5 cells from 2 mice (KD). F, Total number of dendritic branch points in PCs at P10 and P14. Bars represent the mean ± SEM branch points. P10, n = 3 cells from 3 mice (SC and KD), n.s., not significant (p = 0.575 by Student's t test); P14, n = 3 cells from 2 mice (SC and RC) and n = 5 cells from 2 mice (KD), **p = 0.00123 and ##p = 0.00800, respectively (ANOVA followed by Tukey's test). G, Total dendritic length of single PCs at P10 and P14. Bars represent the mean ± SEM total dendritic lengths. P10, n = 3 cells from 3 mice (SC and KD); n.s., not significant (p = 0.818 by Student's t test); P14, n = 3 cells from 2 mice(SC and RC) and n = 5 cells from 2 mice (KD), *p = 0.0105 and **p = 0.00332, respectively (ANOVA followed by Tukey's test).

