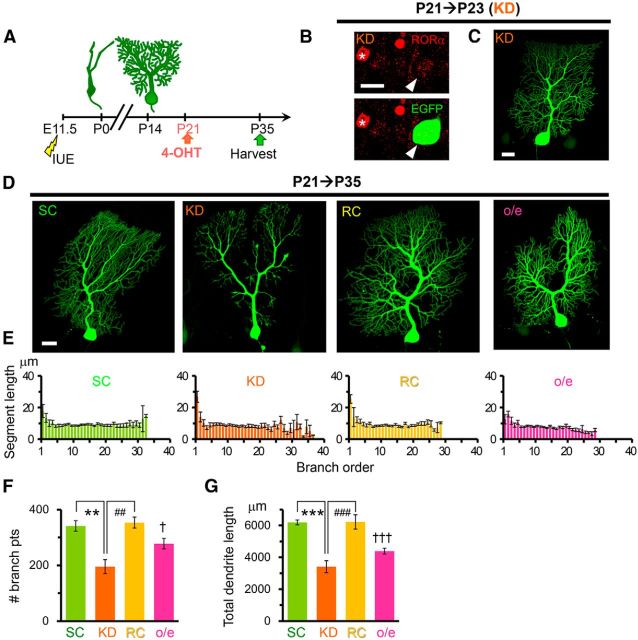
Figure 8.
Knock-down and overexpression of RORα in mature PCs disturb the dendritic morphology. A, Schematic diagram of the experimental procedure. The expression of miR-SC (SC), miR-RORα (KD), miR-RORα plus rRORα1-HA (RC), or rRORα1-HA (overexpression) was induced by 4-OHT at P21. B, Application of 4-OHT at P21 reduced the expression of endogenous RORα in PCs expressing miR-RORα at P23. Immunofluorescent signals for endogenous RORα (red) were examined in EGFP-positive PCs (green, arrowheads). The asterisk indicates a neighboring untransfected PC. Scale bar, 20 μm. C, Gross dendritic arborization of EGFP-positive PCs expressing miR-RORα at P23. Scale bar, 20 μm. D, Knock-down of RORα from P21 induces atrophic PC dendrites at P35. Representative stacked EGFP images of PCs expressing miR-SC (SC), miR-RORα (KD), miR-RORα plus rRORα1-HA (RC), and rRORα1-HA (overexpression) are shown. Scale bar, 20 μm. E, Length of the dendritic segment at each branch order. Bars represent the mean ± SEM segment lengths of n = 5 cells from 3 mice (SC), n = 4 cells from 2 mice (KD), n = 3 cells from 3 mice (RC), and n = 4 cells from 2 mouse (overexpression). F, Total number of dendritic branch points in PCs at P35. Bars represent the mean ± SEM branch points. n = 5 cells from 3 mice (SC), n = 4 cells from 2 mice (KD), n = 3 cells from 3 mice (RC), **p = 0.00129 and ##p = 0.00184, respectively (ANOVA followed by Tukey's test); n = 4 cells from 2 mice (overexpression), †p = 0.0397 (Student's t test vs SC). G, Total dendritic length of single PCs at P35. Bars represent the mean ± SEM total dendritic lengths of the independent experiments. n = 5 cells from 3 mice (SC), n = 4 cells from 2 mice (KD), n = 3 cells from 3 mice (RC), ***p = 0.000227 and ###p = 0.000550, respectively (ANOVA followed by Tukey's test); n = 4 cells from 2 mice (overexpression), †††p = 0.000136 (Student's t test vs SC).

