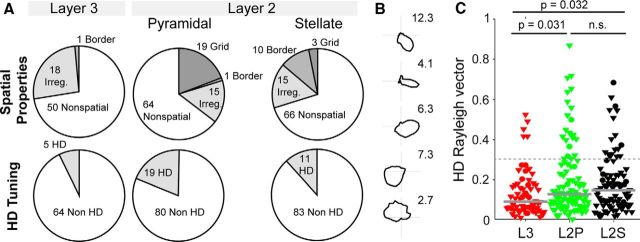
Figure 7.
Spatial firing properties and head directionality of layers 2 and 3 neurons in MEC. A, Distribution of spatial and directional firing patterns observed in MEC layer 3 (left) and layer 2 neurons [identified plus classified in “putative” pyramidal (middle) and “putative” stellate (right) cells; data from Tang et al. 2014b shown for comparison]. B, Layer 3 head-direction cells that met the inclusion criteria (see Materials and Methods) arranged top to bottom according to the head-direction vector length. Peak firing rate in hertz is indicated next to the plots. C, Comparison of the head-direction Rayleigh vector lengths in MEC layer 3 (L3, red) and layer 2 (L2) neurons [identified plus classified in “putative” pyramidal (green) and “putative” stellate (black) cells]. Triangles indicate nonidentified recordings (juxtacellular plus tetrode). Circles indicate cells recorded and identified juxtacellularly. Horizontal lines indicate medians; p values indicate result of Mann–Whitney U test (Bonferroni–Holm corrected for multiple comparisons). Data from MEC layer 2 are from Tang et al. 2014b and are shown for comparison.

