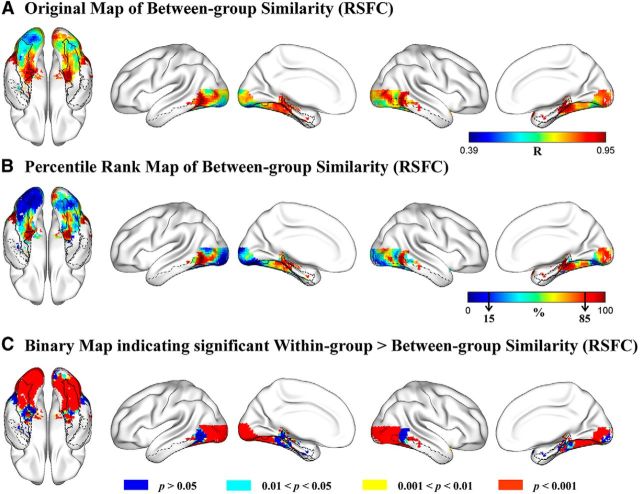
Figure 1.
Comparison of the connectional fingerprints of the VOTC voxels in the blind and sighted groups. A, Original map of Pearson correlation coefficients of RSFC patterns between blind and sighted groups. Color bar represents the Pearson r value. Warmer colors represent greater between-group similarity. B, Percentile rank map of Pearson correlation coefficients of RSFC patterns between blind and sighted groups. Color bar represents the percentile rank value. Warmer colors represent greater between-group similarity. Black arrows in the color bar indicate the bottom and the top 15% similarity. C, Brain map indicating the significance level each voxel reached for the difference between within-group similarity and between-group similarity of RSFC patterns. The contours of bilateral fusiform gyrus (solid black lines), bilateral parahippocampal gyrus (dashed black lines), and bilateral inferior temporal gyrus (dash-dot black lines) are imposed on the brain surface for a clear reference of significant anatomical locations.

