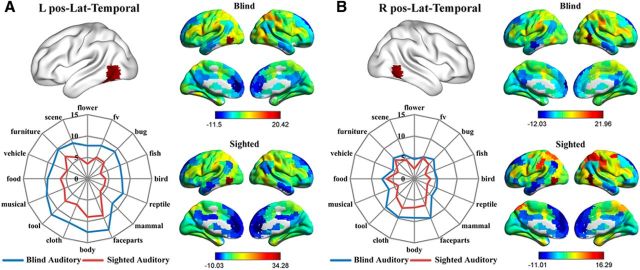
Figure 6.
Connectional fingerprints and functional fingerprints (category response in the auditory experiments) of the (A) left and (B) right posterior lateral temporal clusters. Color scales in the RSFC maps represent the strengths of RSFC between regions (t values). The radial distance in the functional fingerprints reflects the activation strength (β values).

