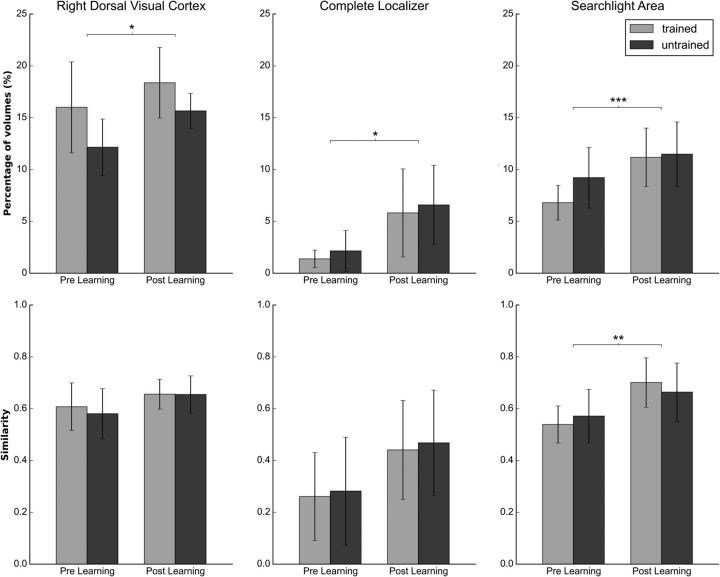
Figure 10.
Comparison of resting-state data before and after training. The figure shows on the average number of brain states that meet the Mahalanobis criterion top row, the similarity index (see text) for each condition on the bottom row, and for each resting-state session in the following three areas: the right dorsal visual cortex, the overlap between the searchlight area and the complete localizer, and the complete searchlight area. Error bars represent the SD. *p < 0.05, **p < 0.01 are not significant after multiple-comparison correction, ***p < 0.005 significant after multiple-comparison correction.

