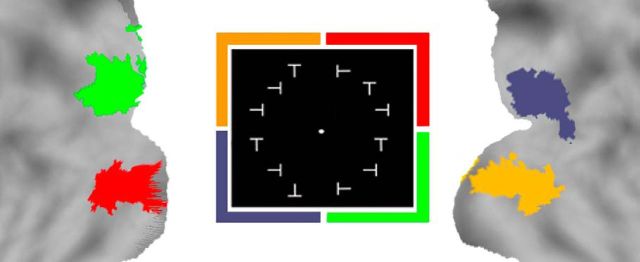
Figure 2.
Localizer defined areas. Areas identified in the localizer session. Each quadrant is referenced by a color, and the same color is used in the brain map to represent the most activated voxels. ROIs were identified in each quadrant as showing the strongest visuotopic localizer responses compared with the average response to stimuli in the other quadrants (group-level, voxelwise, random-effects ANOVAs, multiple-comparison corrected over the entire brain with a p value of <0.05).

