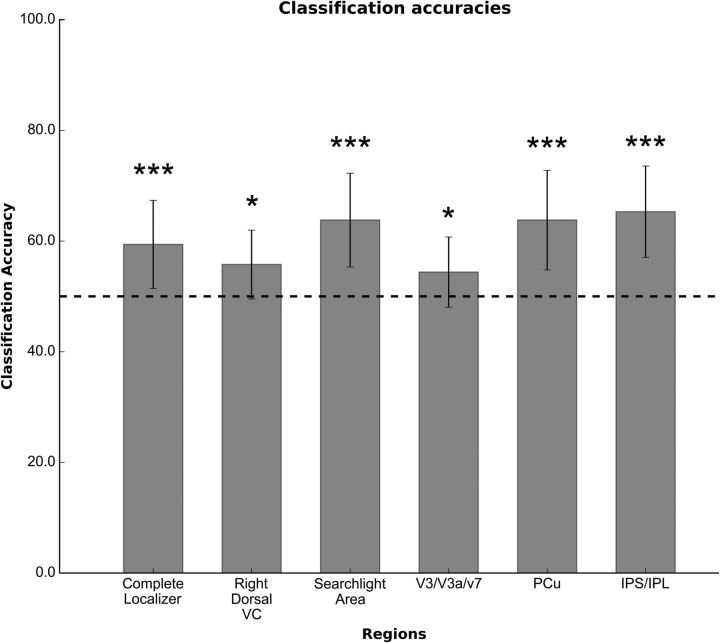
Figure 5.
Classification accuracy on searchlight and visual localizer ROIs. The figure shows the classification accuracies of the spatiotemporal classifier, averaged across subjects, for each ROI. Dashed line indicates the chance level, while error bars represent the SD. *p < 0.05, not significant after multiple-comparison correction; ***p < 0.005, significant after multiple-comparison correction.

