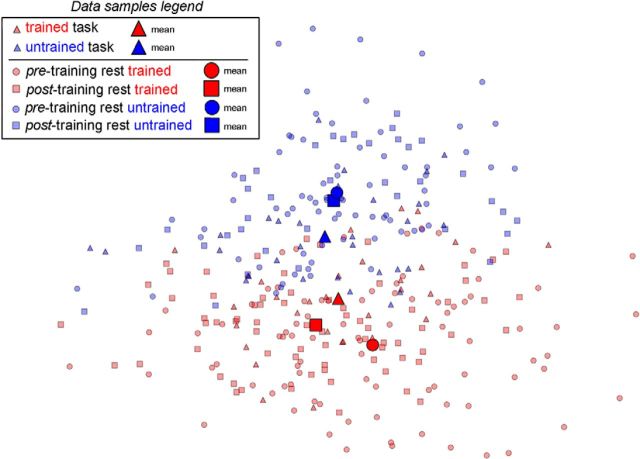
Figure 9.
Subject's dataset projection on a 2D plane. Projection on a 2D plane of a subject spatiotemporal dataset (task and resting state). The feature space before projection corresponds to the whole searchlight region. A PCA was used to reduce the dataset dimensionality, then the transformed data are projected onto the plane defined by the two largest PCs. Triangles represent the task data samples belonging either to the trained (red) or to the untrained (blue) class. Squares represent the resting-state data samples after learning; and circles represent resting-state data samples before learning. The same color coding differentiates resting-state data samples between trained (red) and untrained (blue) as characterized by classification and by selection with the Mahalanobis distance similarity criterion. Larger markers represent the average across the data samples represented by the same shape and color. The means of the resting-state data samples (trained and untrained, respectively), after training, are closer to the means of the corresponding task data.

