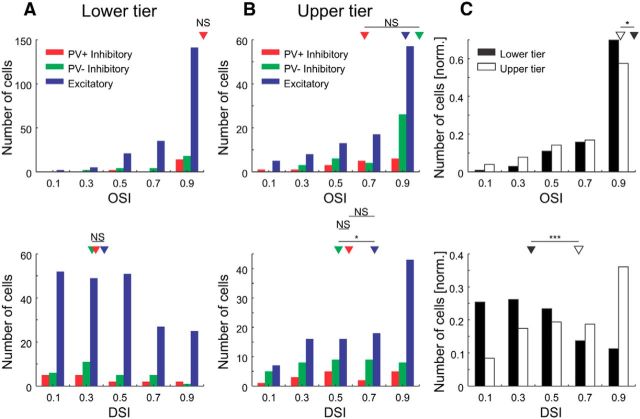
Figure 4.
Orientation and direction selectivity indices. A, Top, Histogram of OSIs for cells in the lower tier of imaging sites (bin size, 0.2; PV+ inhibitory, n = 16; PV− inhibitory, n = 28; excitatory, n = 204). Arrowheads show medians (not binned) of the cell populations (PV+/Exc., p = 0.44; PV+/PV−, p = 0.33; PV−/Exc., p = 0.50; Wilcoxon rank-sum test). Bottom, Histogram of DSIs (same cells as at the top). Arrowheads show medians (not binned) of the cell populations (PV+/Exc., p = 0.97; PV+/PV−, p = 0.57; PV−/Exc., p = 0.32; Wilcoxon rank-sum test). B, Same as A, but for cells in the upper tier of imaging sites (PV+ inhibitory, n = 16; PV− inhibitory, n = 39; excitatory, n = 100). Arrowheads show medians (not binned) of the cell populations (top: PV+/Exc., p = 0.14; PV+/PV−, p = 0.051; PV−/Exc., p = 0.24; bottom: PV+/Exc., p = 0.41; PV+/PV−, p = 0.64; PV−/Exc., p = 0.047; Wilcoxon rank-sum test). C, Same as A, but for cells in the lower and upper tiers of imaging sites pooled over all cell types (lower tier of imaging sites, n = 248; upper tier of imaging sites, n = 155). Arrowheads show medians (not binned) of the cell populations (top, p = 0.042; bottom, p = 3.2 × 10⁻¹¹; Wilcoxon rank-sum test). NS, Not significant; *p < 0.05; ***p < 0.0005.

