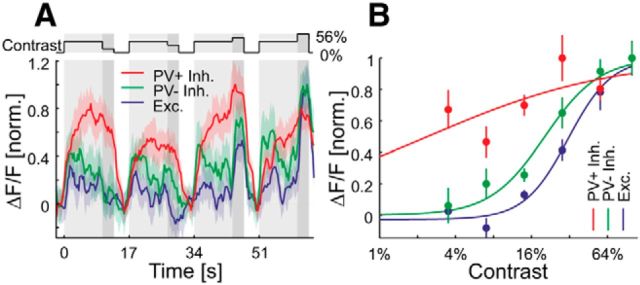
Figure 5.
Contrast response functions of sample cells. A, Light gray, Adaptation to 14% contrast; dark gray, test contrast at 3.5, 7, 28, or 56% (top trace). Responses of sample PV+ (1≙13.8% ΔF/F), PV− inhibitory (1≙28.9% ΔF/F), and excitatory (1≙21.5% ΔF/F) cells to sinusoidal gratings moving in the preferred direction at different contrasts. Curves are plotted as mean ± SEM (shading). B, Naka-Rushton fit to contrast responses of the same cells as in A. Error bars show the SEM.

