Figure 7.
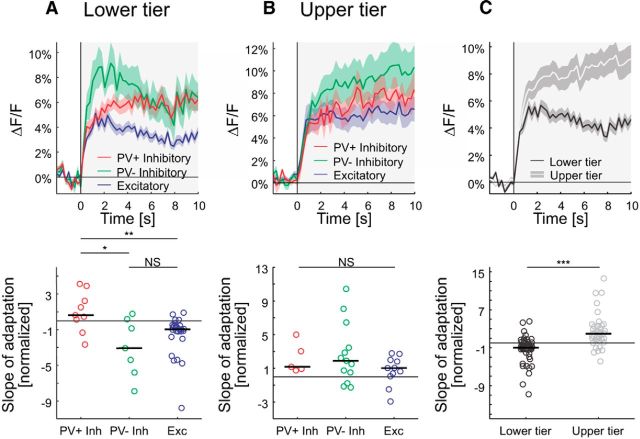
Contrast adaptation. A, Top, Averaged responses of cells in the lower tier of imaging sites to a moving sinusoidal grating at 14% contrast presented for 10 s (PV+ inhibitory, n = 9; PV− inhibitory, n = 7; excitatory, n = 26). Curves are plotted as mean ± SEM (shading). Bottom, Slope of adaptation (normalized by the absolute value of the median slope of putative excitatory cells) for single cells (same cells as at the top). The initial rise was excluded in the estimation of the slope (see Materials and Methods for details). Horizontal bars show medians (PV+/Exc., p = 0.0078; PV+/PV−, p = 0.023; PV−/Exc., 0.47; Wilcoxon rank-sum test). B, Same as A, but for neurons in the upper tier of imaging sites (PV+ inhibitory, n = 5; PV− inhibitory, n = 13; excitatory, n = 11; PV+/Exc., p = 0.22; PV+/PV−, p = 0.92; PV−/Exc., 0.20; Wilcoxon rank-sum test). C, Top, Same as A, but for cells in the upper and lower tier of imaging sites pooled over all cell types (lower tier of imaging sites, n = 42; upper tier of imaging sites, n = 39; p = 3.8 × 10⁻⁷; Wilcoxon rank-sum test). NS, Not significant; *p < 0.05; **p < 0.005; ***p < 0.0005.

