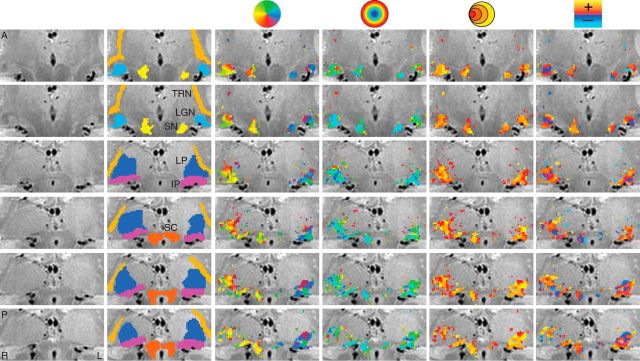
Figure 1.
Maps of the pRF estimates in a single subject across multiple subcortical nuclei. The unlabeled PD image is shown in the first column. The second column depicts the ROIs. The third through sixth columns show the polar angle, eccentricity, pRF size, and HRF delay estimates, respectively. Rows represent separate slices, arranged anterior (A) to posterior (P). L, left; R, right.

