
Figure 3.
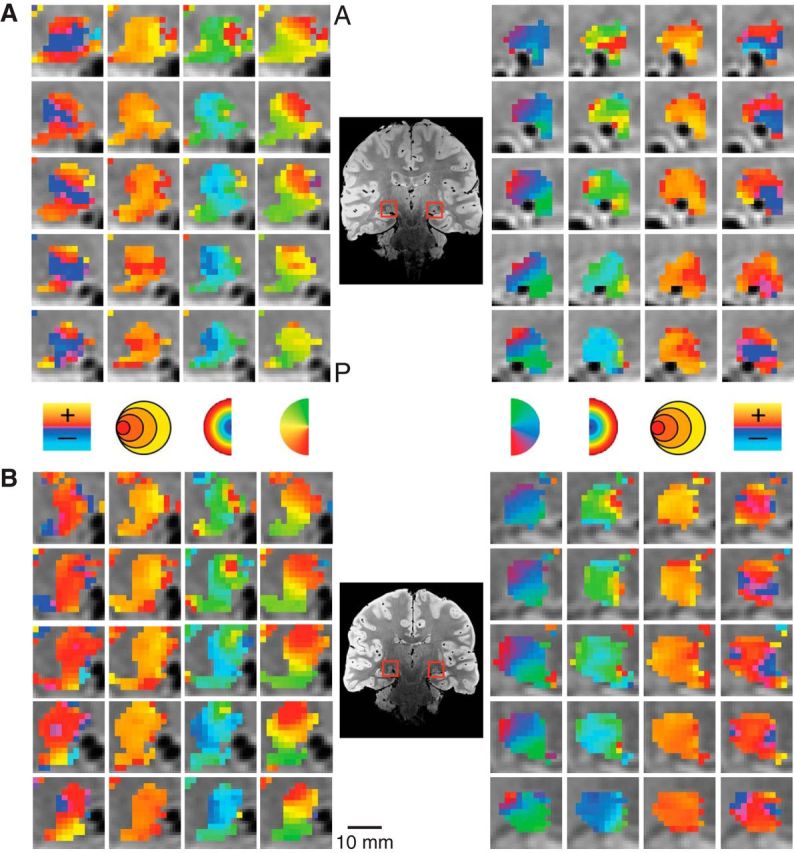
Detailed maps of the pRF estimates in the LGN. The model estimates are overlaid on the PD image for the left and right LGN. Separate subjects are shown in A and B. Columns illustrate the polar angle, eccentricity, pRF size, and HRF delay estimates. A, anterior; P, posterior.