
Figure 1.
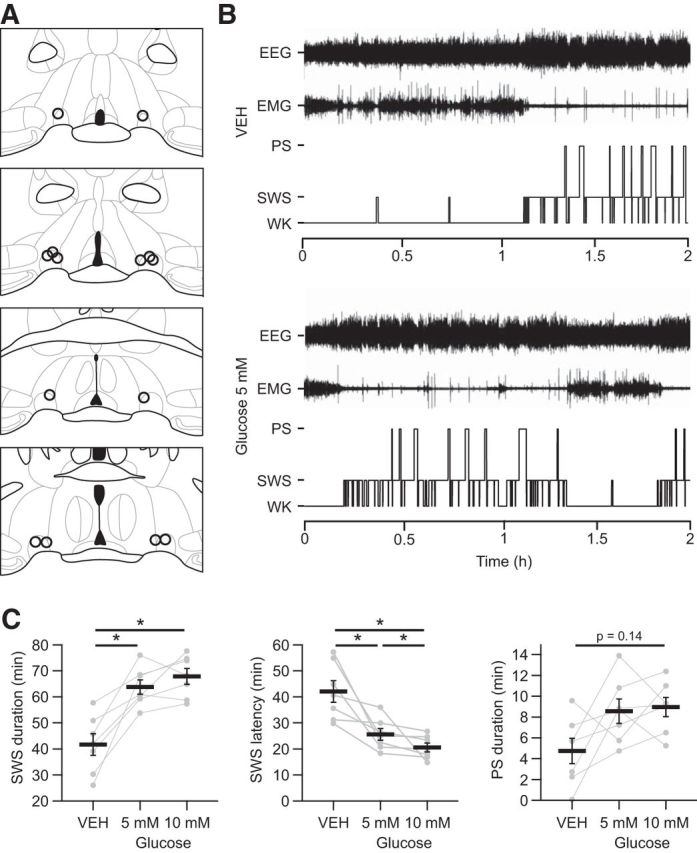
Microinjections of glucose into the VLPO increase sleep. A, Camera lucida drawings of frontal sections illustrating all injection sites (one open circle per animal). The four different sections are evenly spaced (120 μm intervals) throughout the rostrocaudal extent of the VLPO. Bregma coordinates range approximately from 0.26 to −0.22 mm according to the Franklin and Paxinos atlas (2007). B, Hypnograms of a representative animal illustrating the organization of the sleep-waking cycle during the 2 h after a bilateral injection of vehicle (VEH; top) or glucose 5 mm (bottom) into the VLPO. Recordings began immediately after the injection procedure once the animals were returned to their home barrels and reconnected to the recording setup. C, Quantification of SWS durations (left), SWS latencies (middle), and PS (right) durations during the 2 h after bilateral glucose or VEH injection (n = 7). Individual data for each mouse injected bilaterally with glucose or VEH (gray dots and lines) are displayed and data are presented as mean ± SEM (black bars). *p < 0.05, Wilcoxon test.