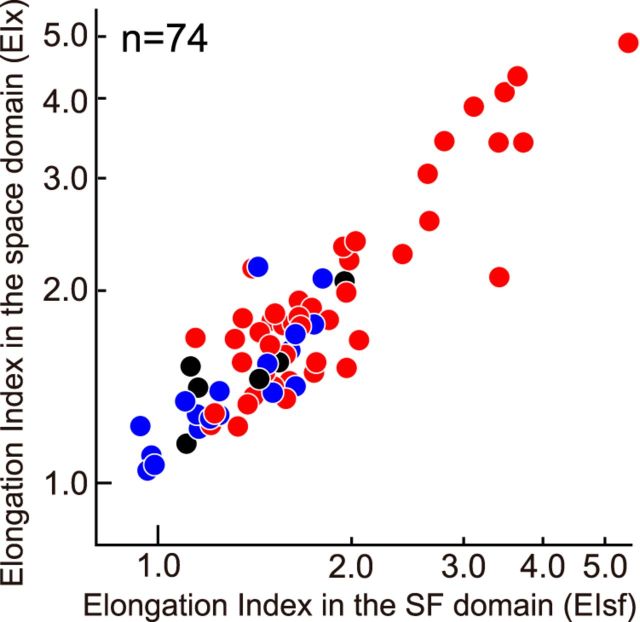
Figure 12.
Relationship is shown between EIsf and elongation index in the space domain along the x-axis (diagonal) in the bRF (EIx). Symbol colors blue, red, and black indicate simple, complex, and unclassified cells, respectively. A significant positive correlation was observed between the two values (r = 0.8, p < 0.001).

