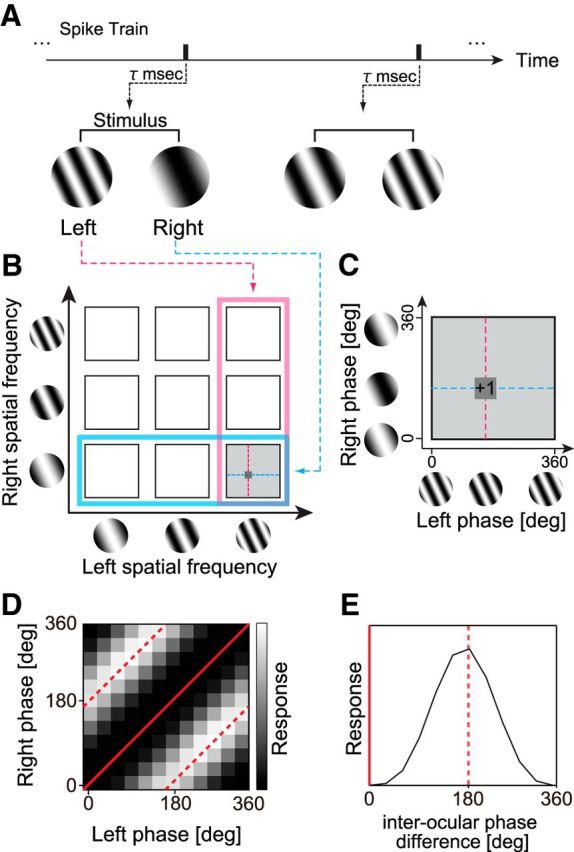
Figure 3.

Reverse correlation analysis was performed to obtain binocular phase selectivity maps for various SF pairs. A, Using spike data recorded while static sinewave grating stimuli were presented dichoptically in rapid flashes, a pair of spike-triggered stimuli was selected for an optimal correlation time delay. The spike-triggered SF and phase parameters in the left and right eyes were extracted for the selected grating pair. B, A spike was voted in a 4-D domain (sfL, sfR, phL, phR). For clarity of understanding the 4-D data, the procedure may be understood in the following steps. First, spike-triggered pair of SFs (sfL, sfR) was determined (left, pink; right, cyan). The selected pair is indicated by a gray square. C, Then, within the selected joint phase subdomain (phL, phR), the spike was voted into a particular phase combination for the triggered stimulus pair. Repeating this procedure for all recorded spikes, complete binocular phase selectivity maps were obtained for various SF pairs between the two eyes. D, The model response of a typical disparity energy unit is illustrated in the joint (phL, phR) subdomain, for the combination of optimal (sfL, sfR). The strength of response is shown with gray scale. Constant interocular phase-difference lines are indicated with red (solid line for 0° and broken line for 180°). E, One-dimensional tuning curve to interocular phase difference was derived from D by integrating it along constant disparity lines.
