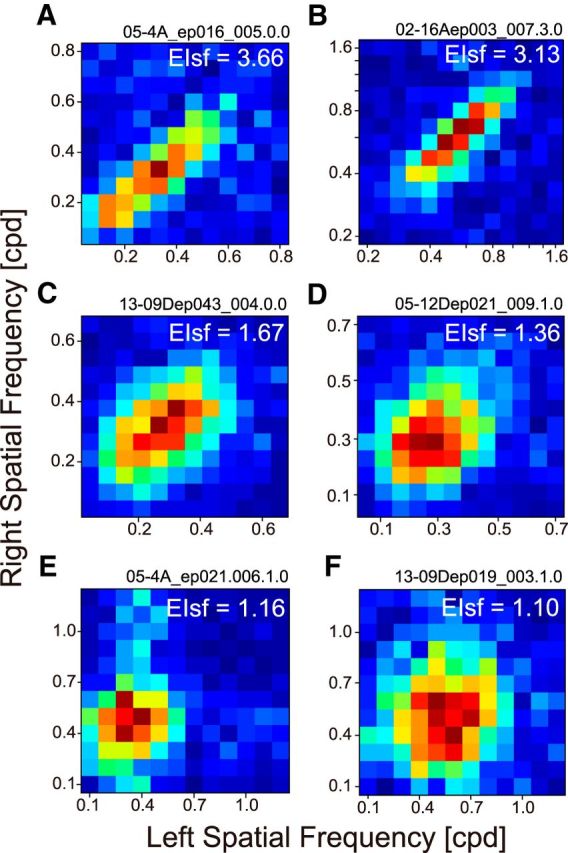
Figure 6.

Binocular SF interaction maps showed various degrees of elongation across neurons. These maps are arranged in the descending order of EIsf. Value of EIsf is shown at the upper-right corner. A, Optimal SF was 0.36 cpd, and optimal orientation (OR) was 163° for the dominant eye. B, SF: 0.64 cpd, OR: 19°. C, SF: 0.30 OR: cpd, 96°. D, SF: 0.27 cpd, OR: 1°. E, SF: 0.38 cpd, OR: 103°. F, SF: 0.56 cpd, OR: 9°. Values were similar for the nondominant eye (data not shown). Cells for E and F were of simple type, whereas the remaining cells were complex.
