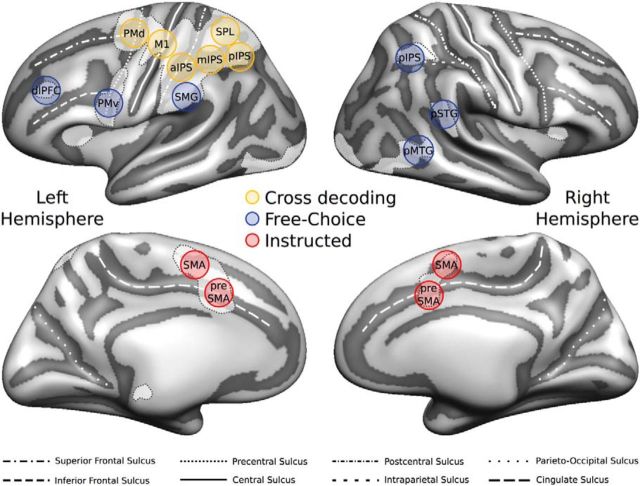
Figure 6.
Summary of decoding results for the Planning phase. Circles superimposed on the group-averaged surface mesh represent examples of individual spherical ROIs color-coded according to the results of the ROI MVPA: yellow represents significant cross-condition decoding; blue represents preferential decoding for Free-Choice planning; red represents preferential decoding for Instructed planning. White-shaded areas with dashed outlines represent the statistical map revealed by the univariate contrast [Planning > Baseline].

