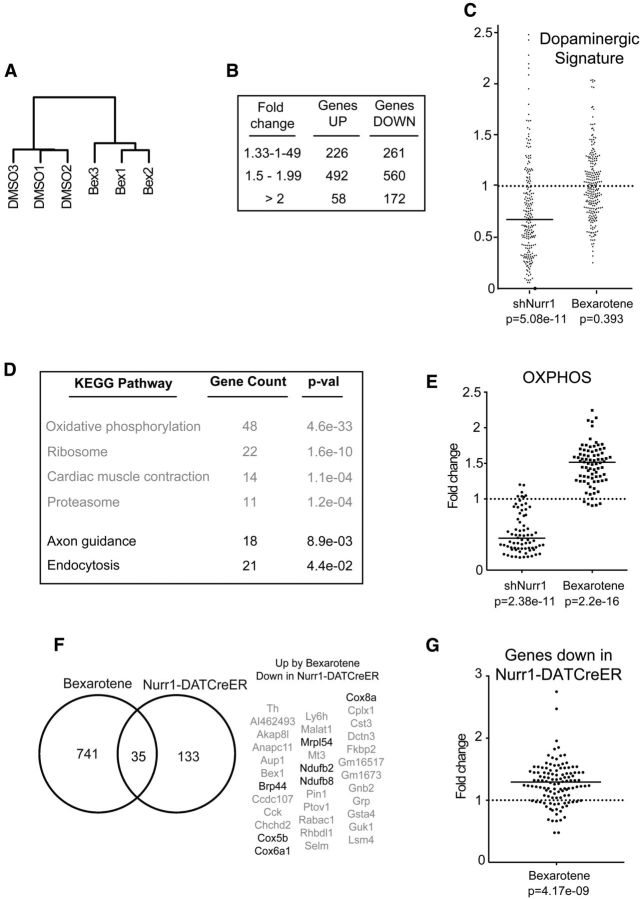
Figure 4.
RNA sequencing of FACS-sorted Pitx3-eGFP DA neurons treated with bexarotene or vehicle. A, Cluster dendrogram showing the similarity between the different RNASeq samples based on their Spearman correlation. B, Table showing the number of genes with an RPKM value >1 that are upregulated or downregulated by bexarotene (padj < 0.05). C, Scatter diagram showing the fold change of the RPKM values for the DA signature genes after infection with shNurr1 lentivirus or treatment with bexarotene. Bar shows the median value. D, Table showing the gene count and p values (after multiple hypothesis testing with the Benjamini–Hochberg method) for the significantly upregulated and downregulated KEGG (Kyoto Encyclopedia of Genes and Genomes) pathways in bexarotene-treated DA neurons. E, Scatter diagram showing the fold change of the RPKM values for oxidative phosphorylation genes after infection with shNurr1 lentivirus or treatment with bexarotene. Bars show median values. F, Left, Venn diagram showing the overlap between the genes significantly (padj < 0.05) upregulated by bexarotene treatment and the genes significantly (padj < 0.05) downregulated in DA neurons of Nurr1-DATCreER animals. Right, Table with the 35 overlapping genes with genes encoding proteins with a function in mitochondria being highlighted. G, Scatter diagram showing the fold change of the RPKM values by bexarotene for the genes significantly downregulated in Nurr1-DATCreER animals. Bar shows the median value.

