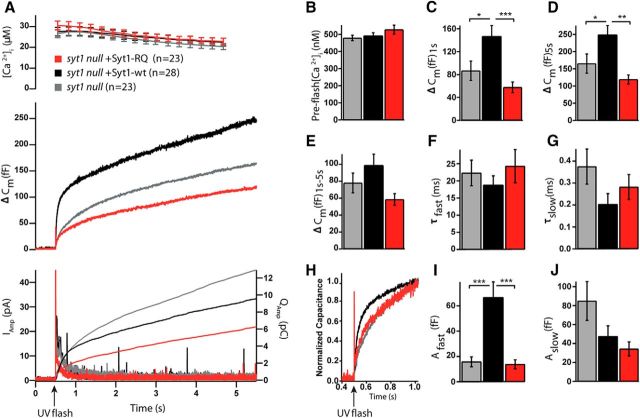
Figure 4.
Syt1-RQ mutant impaired secretion in syt1 null cells. A, Mean membrane capacitance and Ca2+ measurements of syt1 null (gray) with Syt1-wt overexpression (black) and Syt1-RQ mutant (red). B, Quantification of preflash [Ca2+]. C, Burst size was higher in Syt1-wt overexpression than Syt1-RQ overexpression and syt1 null (ΔCm at 1 s; Kruskal–Wallis test, p < 0.001; result of pairwise post-tests, syt1 null vs Syt1-wt overexpression, p = 0.016; Syt1-wt overexpression vs Syt1-RQ, p < 0.001). D, The same was true of total release size (ΔCm at 5.5 s, Kruskal–Wallis test, p = 0.004; result of pairwise post-tests, syt1 null vs Syt1-wt overexpression, p = 0.035; Syt1-wt overexpression vs Syt1-RQ, p = 0.005). E, For sustained release, the difference was almost, but not quite, significant (ΔCm at 5.5–1 s; Kruskal–Wallis test, p = 0.051). F, G, I, J, Fitting individual capacitance traces with a sum of exponentials allowed separating the amplitude and time constant of fast burst secretion from the amplitude and time constant of slow burst secretion. Only the amplitude of the fast burst (Afast) was significantly different between groups (Kruskal–Wallis test, p < 0.001; result of pairwise post-tests, syt1 null vs Syt1-wt overexpression, p < 0.001; Syt1-wt overexpression vs Syt1-RQ, p < 0.001). H, Scaled version of the mean capacitance traces in A clearly show the fast component in the Syt1-wt overexpression, which is missing from syt1 null and Syt1-RQ overexpression. Error bars indicate SEM.

