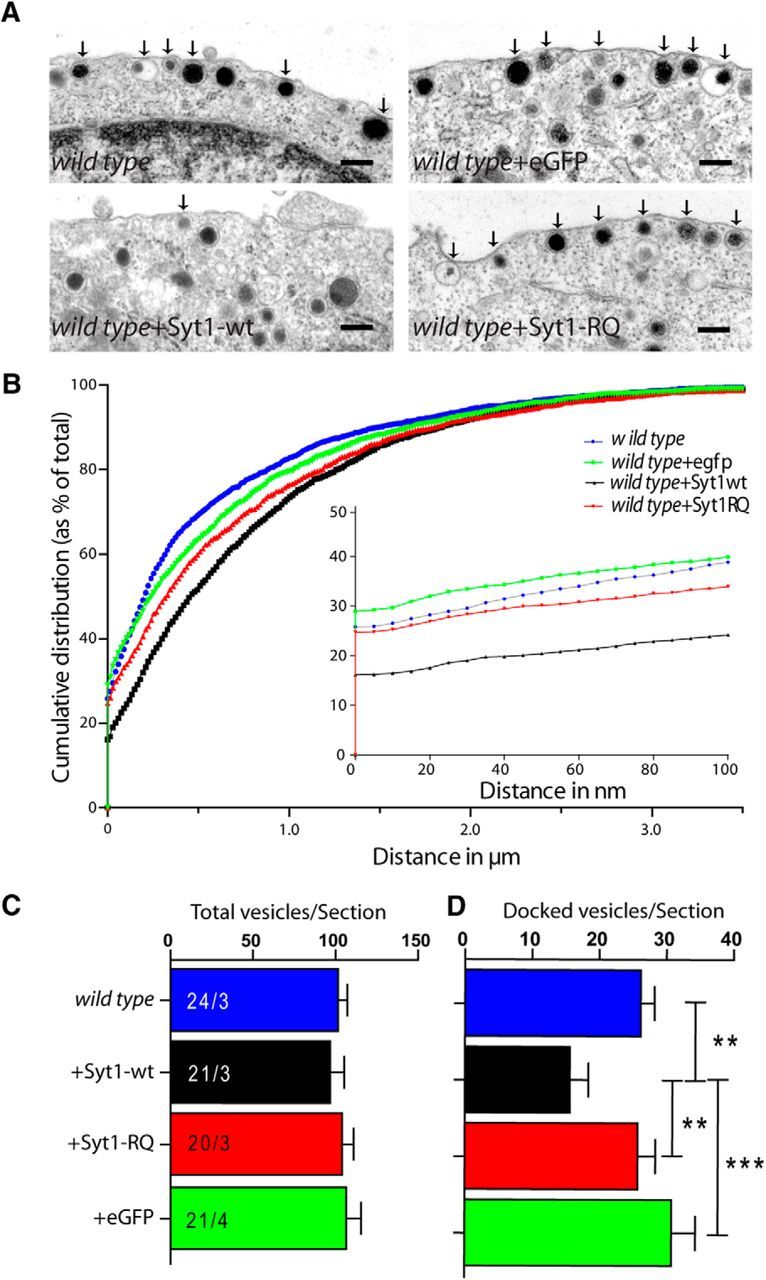
Figure 6.

Syt1-wt overexpression in wild type chromaffin cells reduces docking. A, Ultrastructural images of different noninfected and infected conditions on the wild-type cell background. Scale bars: 200 nm. Arrows mark docked vesicles. B, Normalized cumulative distribution of vesicles as a function of the distance from the plasma membrane. Inset, The distance range of 0–100 nm from the membrane. C, D, Numbers of total (C) and docked (D) vesicles per section showing a significant reduction in docking in Syt1-wt-overexpressing wild-type cells. Error bars indicate SEM.
