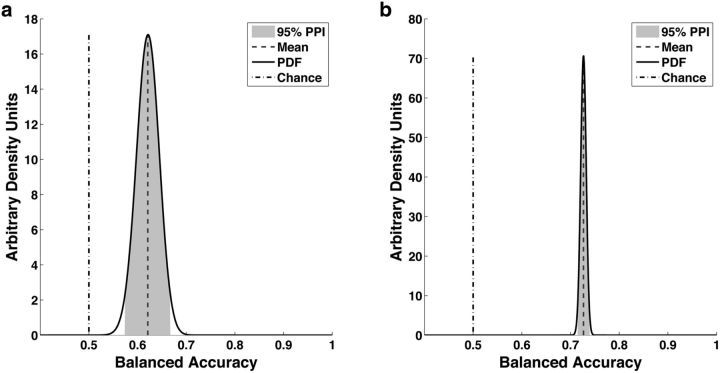
Figure 2.
vmPFC response to imagined juice rewards predicts monetary ITC behavior both between and within individuals. a, The solid black curve indicates the posterior density function (PDF) of the balanced accuracy achieved when using imagined juice responses in vmPFC to determine the relative discounting rates between participants. Light gray shading represents the 95% posterior probability interval (PPI). Dark gray dashed line indicates the mean of the posterior balanced accuracy while the dashed-dotted line depicts chance. b, The solid black curve indicates the PDF of the balanced accuracy achieved when using imagined juice responses in vmPFC to predict choices on each individual trial. Light gray shading represents the 95% PPI. Dark gray dashed line indicates the mean of the posterior balanced accuracy while the dashed-dotted line depicts chance.

