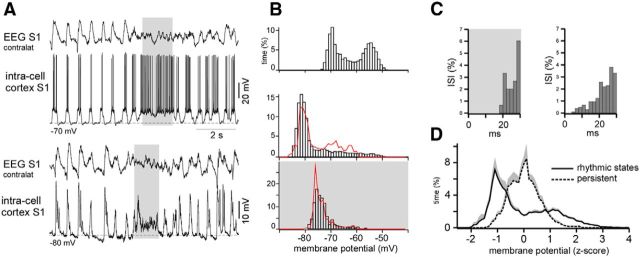
Figure 3.
Membrane potential distribution during the slow oscillation and persistent activity in the cortex. A, An example of the intracellular membrane potential recorded in the somatosensory cortex of a lightly anesthetized mouse (top traces, zero injected current; bottom traces, the same cell was hyperpolarized with injected current). Periods of spontaneous persistent activity are indicated with gray. B, The membrane potential distribution plotted for the spiking trace shown in A (top). The membrane potential distribution of a hyperpolarized cell during slow-wave activities (middle). The red curve represents the distribution of the filtered membrane potential during the same period (see Results). The bottom shows the membrane potential distribution of a hyperpolarized cell during persistent activity. The red curve represents the distribution of the filtered membrane potential during the same period (see Results). C, Interspike intervals (ISIs) of the same neuron during persistent activity (left) and slow oscillation (right). D, Averaged (n = 10 neurons) distributions of the membrane potentials (subthreshold conditions) during slow oscillation and persistent activity.

