
Figure 2.
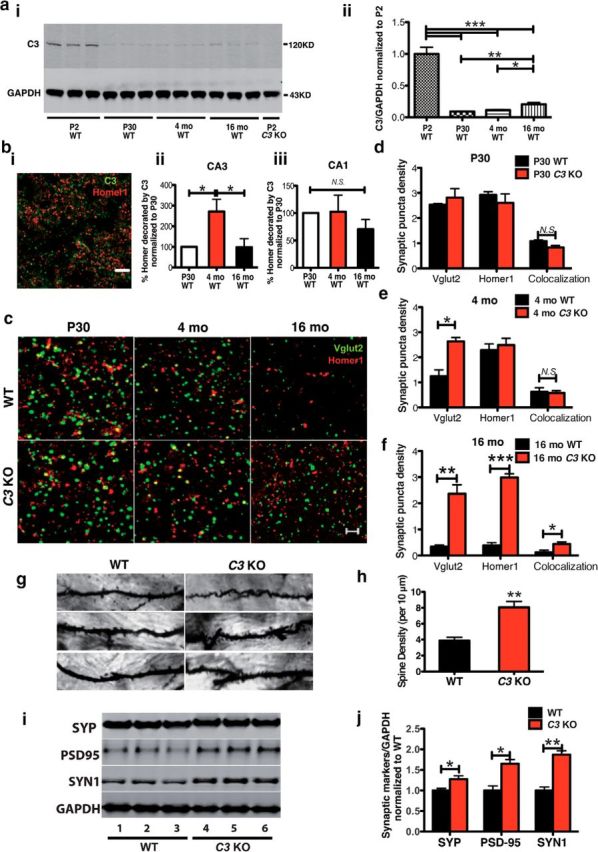
Complement C3 deficiency rescues age-dependent synapse loss in C57BL/6 WT mice. a, Western blotting of C3 in HC homogenates of WT mice at P2, P30, 4-month-old, and 16-month-old WT mice and P2 C3 KO mice. C3 protein levels in WT mice were high at P2, but dropped dramatically by P30. The C3 protein was absent in C3 KO mice. C3 protein levels were modestly but significantly elevated in P30 compared with 16 months of age. (*p < 0.05, **p < 0.01, ***p < 0.0001, one-way ANOVA; n = 3 mice per age). b, Confocal image of C3 (green) and Homer1 (red) synaptic puncta in CA3 of a 4-month-old WT mouse. Scale bar, 10 μm (i). b, The density of C3-tagged Homer1 puncta was significantly increased in CA3 (ii) but not CA1 (iii), of WT mice at 4 months of age compared with P30 and 16 months of age. (*p < 0.05, n = 4 or 5 mice per age; one-way ANOVA). c, High-resolution confocal microscopy of presynaptic (Vglut2, green) and postsynaptic (Homer1, red) IR puncta in CA3 of HC in WT and C3 KO mice at P30, 4 months, and 16 months of age. Scale bar, 5 μm. d, At P30, WT and C3 KO mice had similar synaptic puncta densities. e, f, At 4 months, Vglut2-synaptic density was higher in C3 KO versus WT mice, whereas at 16 months, Homer1, Vglut2, and colocalized puncta were significantly increased in C3 KO mice compared with WT mice (*p < 0.05, **p < 0.01, ***p < 0.001, n = 6 mice per age and genotype; 3 equidistant planes 200 μm apart per mouse; unpaired Student's t test). g, Golgi staining of dendritic spines in CA3 of WT and C3 KO mice at 16 months of age. Scale bar, 10 μm. h, Quantification of Golgi-labeled dendritic spines revealed a significant increase in spine density in C3 KO mice compared with WT at 16 months of age (**p < 0.01, n = 2 mice per genotype; unpaired Student's t test). i, j, Western blotting of HC homogenates revealed elevated SYP, PSD95, and SYN1 synaptic proteins in 16-month-old C3 KO mice compared with age-matched WT mice (*p < 0.05, **p < 0.01, n = 6 mice per age and genotype; unpaired Student's t test). N.S., Not significant.