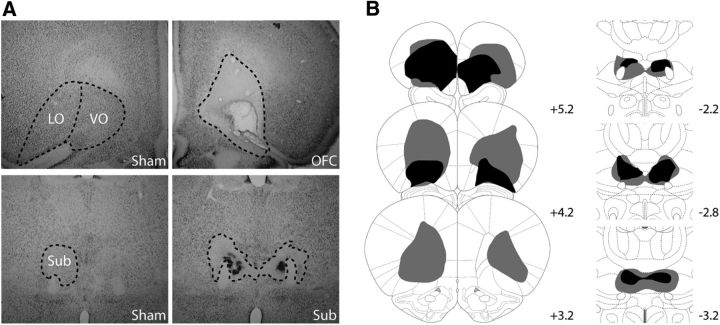
Figure 2.
Histology. A, Representative photomicrographs of the OFC (top) and Sub regions (bottom) in Sham (left) and lesioned rats (right). B, Representation of the included largest (gray) and smallest (black) OFC (left) and Sub (right) lesion at three different levels of the anteroposterior axis (indicated in millimeters relative to bregma).

