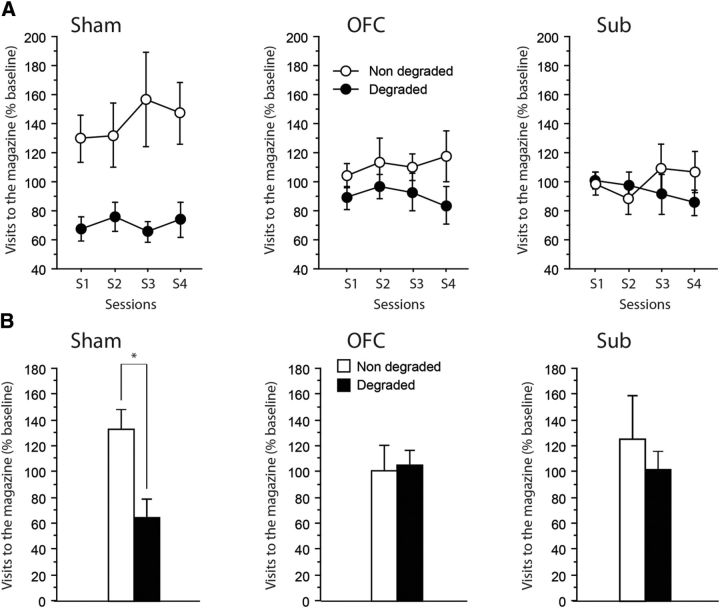
Figure 6.
Degradation of Pavlovian contingencies. A, B, Magazine visits expressed relative to the last session of acquisition (percentage) during (A) acquisition of the new contingencies (4 sessions) and (B) the test conducted without rewards. Results are shown for the nondegraded (white) as well as the degraded (black) contingencies for Sham (left), OFC (middle), and Sub (right) groups. Data are expressed as mean ± SEM. Degradation, *p < 0.05.

