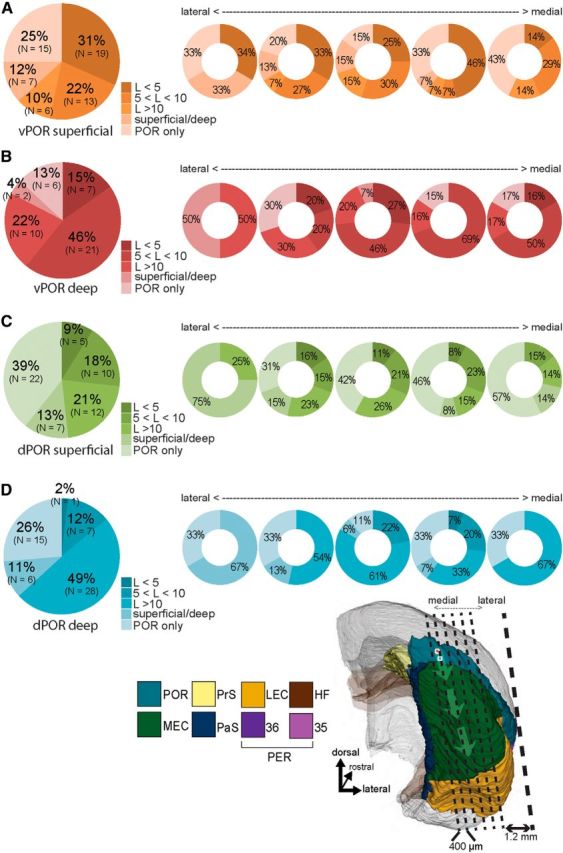
Figure 5.

Grouping of the slices according to response latencies, measured with VSD. A, Ventral POR superficial stimulation (N = 60). B, Ventral POR deep stimulation (N = 46). C, Dorsal POR superficial stimulation (N = 56). D, Dorsal POR deep stimulation (N = 57). Left, Pie charts represent the percentage of slices, averaged across all mediolateral positions, showing response latencies in MEC as indicated by the color code. Ventral POR superficial stimulation (A) resulted in short latency responses in a higher number of slices compared with the other stimulation sites (χ(1)2 = 19.2, p < 0.001) (B–D). A–D, Right, Doughnut charts represent the percentage of slices, grouped with respect to their relative mediolateral position, showing color-coded latencies. Response latencies depend on the position of the stimulation as well as the relative mediolateral position of the slice (the approximate mediolateral position of the five 400-μm-thick slices is indicated in the inset; compare with Fig. 1A).
