
Figure 3.
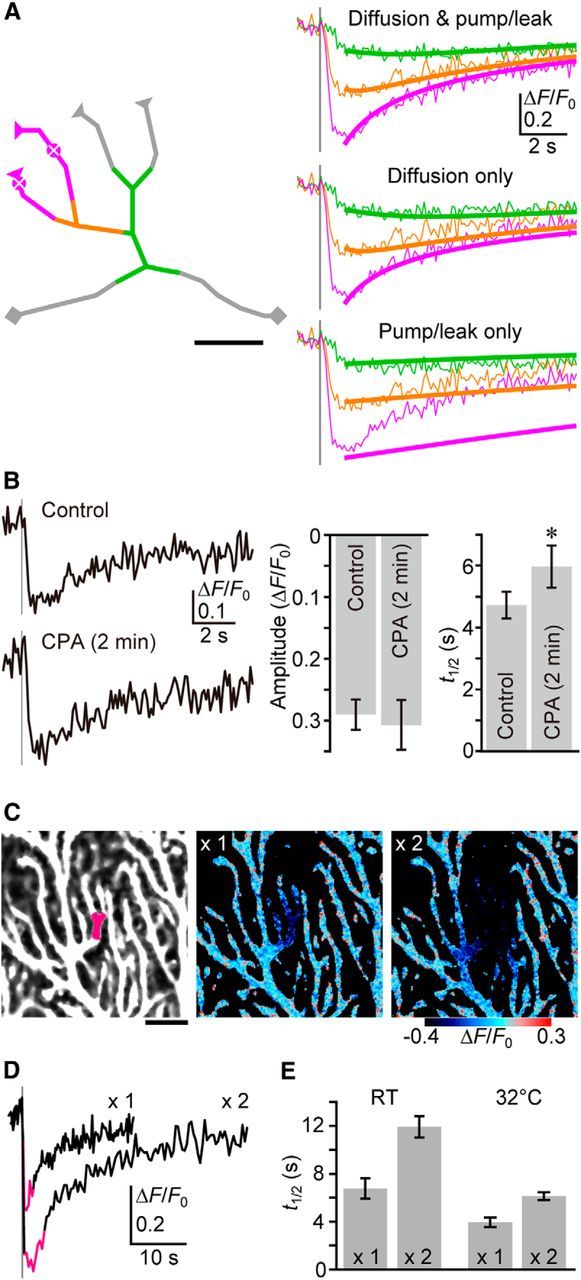
Contribution of intraluminal Ca2+ diffusion to ER refilling after PF inputs. A, Numerical simulation of ER Ca2+ dynamics during the refilling period. Left, The actual dendritic structure shown in Figure 2A was manually skeletonized, and reaction-diffusion modeling performed. The triangles on the terminals indicate the dead-end boundary, while the squares indicate the open-end boundary. Dendritic segments for the calculation of ΔF/F0 were indicated by colors, as in Figure 2A. The central points of response (the bottom points of the initial distribution of [Ca2+]ER) were marked. Scale bar, 5 μm. Right, The recovery phase of G-CEPIA1er response was fitted to the model. ΔF/F0 traces (thin lines) are color coded as for those shown in Figure 2A. The reaction-diffusion model faithfully reproduced the recovery time course in each dendritic segment (thick lines). The calculated effective diffusion coefficient of Ca2+ in ER lumen was 8.4 μm2/s. Simulated results for no diffusion and no pump/leak were produced by resetting the each coefficient to 0 after data fitting. For details, see Materials and Methods. B, The effect of short-term treatment with CPA (50 μm, 2 min) on the replenishment rate. Representative time courses of ΔF/F0 upon PF inputs (five stimuli at 100 Hz, gray vertical line), and the summarized bar graph for ΔF/F0 amplitude and t1/2 are shown. t1/2 is the time point at which ΔF/F0 recovered by half. n = 7 (mean ± SEM). *p = 0.00581, t test. C, The area of PF-induced [Ca2+]ER decrease was enlarged by a twofold increase of stimulation intensity (indicated as ×2). The pseudo-color images are the averages of 10 consecutive frames (indicated as magenta in ΔF/F0 traces in D). Scale bar, 10 μm. D, Representative time courses of ΔF/F0 within the dendritic segment (indicated by magenta in the top left image in C) upon PF inputs (five stimuli at 100 Hz, gray vertical line). E, The summarized bar graph for t1/2 under RT or 32°C. (n = 8 each, mean ± SEM).