
Figure 4.
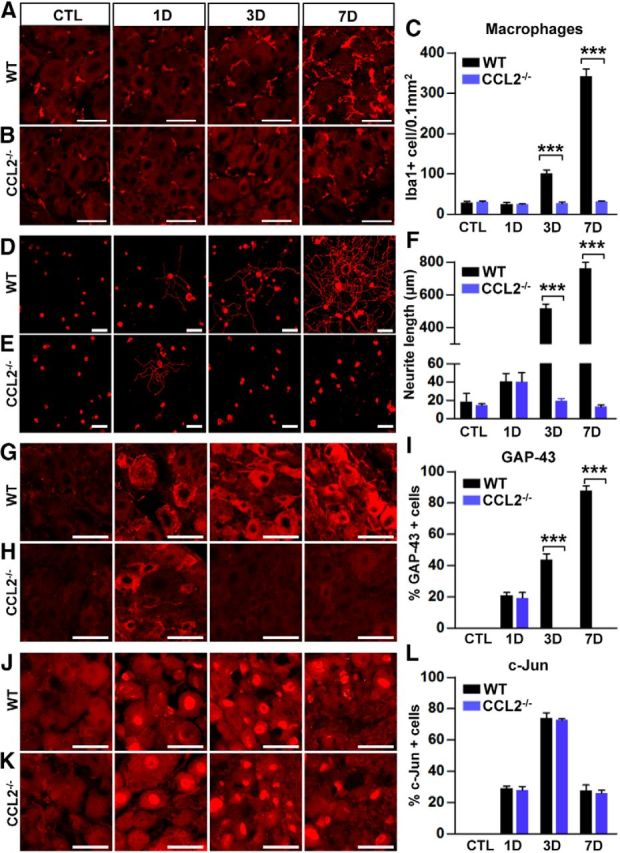
Changes in the number of macrophages in DRG, axon growth capacity, and expression of RAGs in CCL2-deficient mice. A, B, Representative images of Iba1-positive macrophages in DRGSs of WT (A) and CCL2−/− (B) mice at different time points after SNI. C, Quantification of the number of macrophages in WT and CCL2−/− mice 0 (CTL), 1, 3, and 7 d after SNI. N = 3 animals for each condition. Scale bars, 50 μm. D, E, Representative images of neurite outgrowth of DRG neurons taken from WT (D) and CCL2−/− (E) mice at different time points after SNI. Neurons from the L4, L5, and L6 DRGs were cultured for 15 h before being fixed for the immunofluorescent visualization of neurites with anti-β III tubulin. Scale bar, 100 μm. F, Comparison of the mean neurite length between cultures from WT and CCL2−/− mice 0 (CTL), 1, 3, and 7 d after SNI. N = 4 animals for each condition. ***p < 0.001 compared with WT values by unpaired t test. G, H, J, K, Representative immunofluorescence images of GAP-43 (G, H) or c-Jun (J, K) staining in L5 DRG sections obtained from WT (G, J) and CCL2−/− (H, K) mice at different time points after SNI. Scale bars, 50 μm. I, L, Quantification graphs of the percentage of GAP-43-positive (F) or c-Jun-positive (I) cells in WT and CCL2−/− mice 0 (CTL), 1, 3, and 7 d after SNI. N = 3 animals for each condition. ***p < 0.001 compared with WT values by one-way ANOVA followed by Tukey's post hoc analysis.