Figure 2.

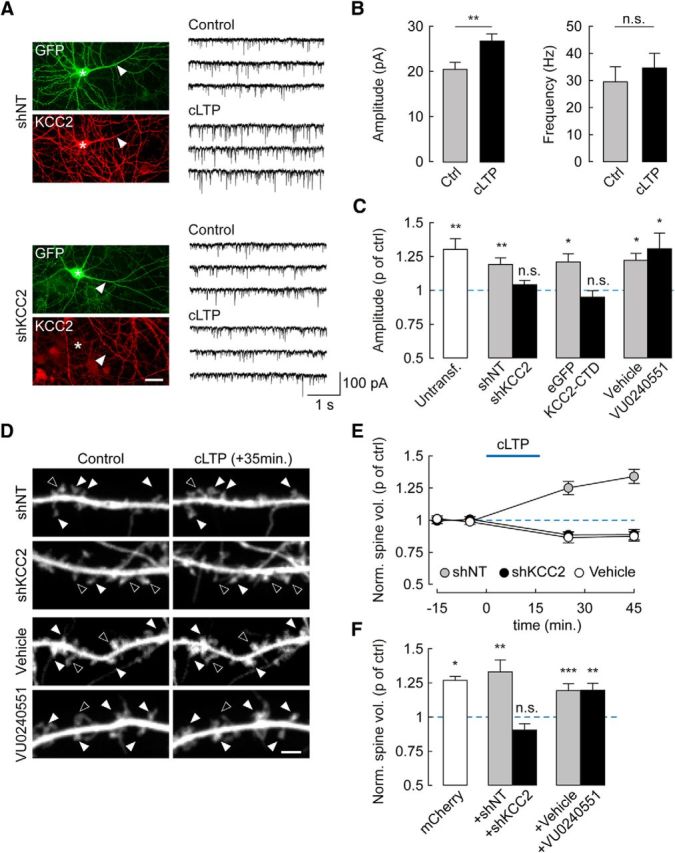
KCC2 suppression precludes cLTP expression through an ion transport-independent mechanism. A, Left, Wide-field fluorescence micrographs showing GFP fluorescence and KCC2 immunolabeling in hippocampal neurons transfected with nontarget (shNT, top) or KCC2-specific (shKCC2, bottom) shRNA. Stars and arrows represent the soma and primary dendrite of transfected cells, respectively. Scale bar, 20 μm. Right, 12 s recordings of mEPSCs from neurons either after cLTP protocol (see Materials and Methods, cLTP) or vehicle application only (DMSO 0.6 μl/ml, Control). B, Summary data from 16 (Ctrl) and 19 (cLTP) untransfected neurons showing that cLTP specifically increases mEPSC amplitude (p < 0.01) but not frequency (p = 0.5). C, Summary data showing change in mEPSC amplitude (proportion of control) upon cLTP in untransfected neurons (p < 0.01), or neurons expressing either nontarget (p < 0.01) or KCC2-specific shRNA (p = 0.2), eGFP alone (p < 0.05), or eGFP with KCC2 carboxy-terminal domain (KCC2-CTD, p = 0.4), and neurons exposed to the KCC2 antagonist VU0240551 (6 μm, p < 0.05) or vehicle only (DMSO, p < 0.05). n = 11–18 in each condition. D, Spinning disc confocal fluorescence micrographs of dendritic sections of neurons expressing mCherry and either shNT or shKCC2, or exposed for 72 h to VU0240551 or vehicle only. Images represent maximal projections of confocal stacks acquired 15 min before and 35 min after cLTP induction. Filled arrowheads indicate spines that increased in volume during cLTP. Open arrowheads indicate spines that decreased in volume or remained unchanged. Scale bar, 2 μm. E, Time course of changes in spine volume upon cLTP in neurons expressing shNT (n = 11), shKCC2 (n = 9), and neurons expressing mCherry only and exposed for 16 min to vehicle only (vehicle, n = 6). F, Summary graph of average spine volume (normalized to control before cLTP induction) measured 30 min after cLTP induction in neurons expressing mCherry alone (n = 7), or together with shNT (n = 11), shKCC2 (n = 9), or after 72 h exposure to VU0240551 (n = 14) or vehicle only (n = 20). *p < 0.05. **p < 0.01. ***p < 0.005. n.s., Nonsignificant difference.
