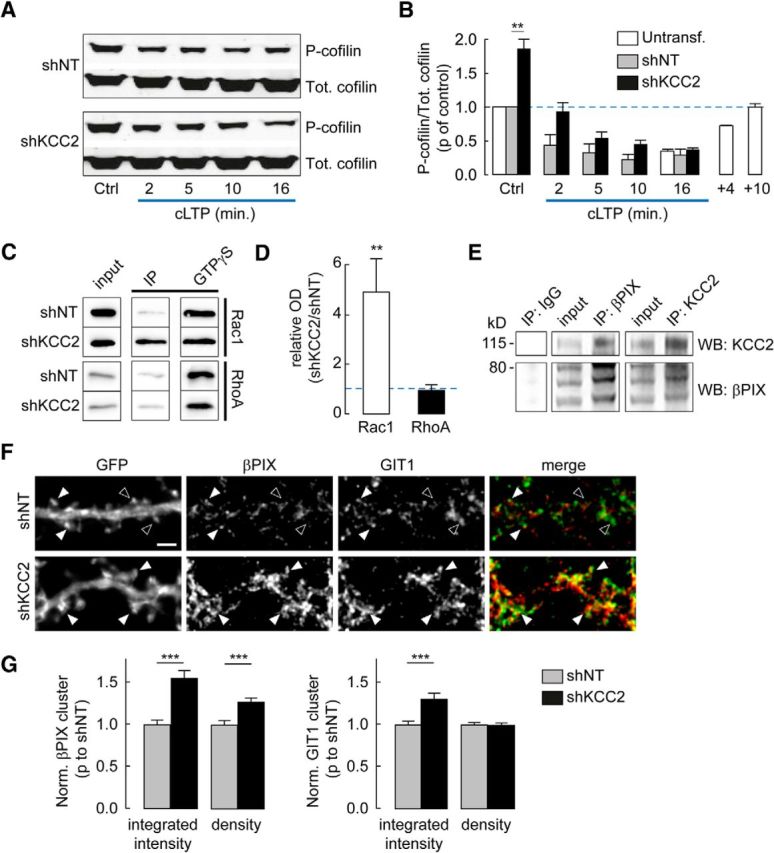
Figure 7.

Phosphorylation of cofilin and recruitment of Rac1 signaling in neurons lacking KCC2. A, Representative immunoblots of total (Tot.) or Ser3-phosphorylated (P-) cofilin from hippocampal cultures transduced with lentiviruses expressing either nontarget (shNT) or KCC2-directed (shKCC2) shRNA, before (Ctrl) or at different times of cLTP induction. B, Quantification from three independent experiments of pSer3/total cofilin ratios from immunoblots as in A, normalized to that in shNT-expressing neurons before cLTP induction. Note the twofold increase in pSer3/total cofilin ratio in shKCC2-expressing neurons before cLTP induction. **p < 0.01. White bars represent data from uninfected neurons, showing a transient, ≈75% decrease in pSer3/total cofilin ratio during cLTP induction with complete recovery within 10 min. C, Western blots from cultures transduced with lentiviruses expressing shNT or shKCC2, probed with Rac1 (left) or RhoA (right) antisera after pull-down assays using GST-PAK (Rac1) or GST-Rhotekin (RhoA) in the absence (IP) or presence (GTPγS) of 200 μm GTPγS. D, Quantification from 4 (Rac1) and 3 (RhoA) experiments as in C, expressed as the ratio of activated Rho GTPase signal normalized to maximal activity in GTPγS, in protein extracts from neurons expressing shKCC2 over neurons expressing shNT. **p < 0.01. E, Coimmunoprecipitation (IP) experiment from uninfected neuron cultures at 21 DIV. Western blots (WB) show enrichment and detection of βPIX after KCC2 pull-down (middle) and reciprocally (left). F, Wide-field fluorescent micrographs of representative dendritic sections of neurons expressing EGFP and either nontarget (shNT) or KCC2-directed shRNA (shKCC2). Neurons were immunostained for GFP, βPIX (red), and GIT1 (green). Filled arrowheads indicate dendritic spines immunopositive for both βPIX and GIT1. Open arrowheads indicate spines with no colocalization. Scale bar, 2 μm. G, Quantification of βPIX (left) and GIT1 (right) cluster integrated intensity and density, normalized to that in shNT-expressing neurons. Data are from two independent experiments as in F, and 104 (shNT) and 110 (shKCC2) cells, respectively. ***p < 0.001.
