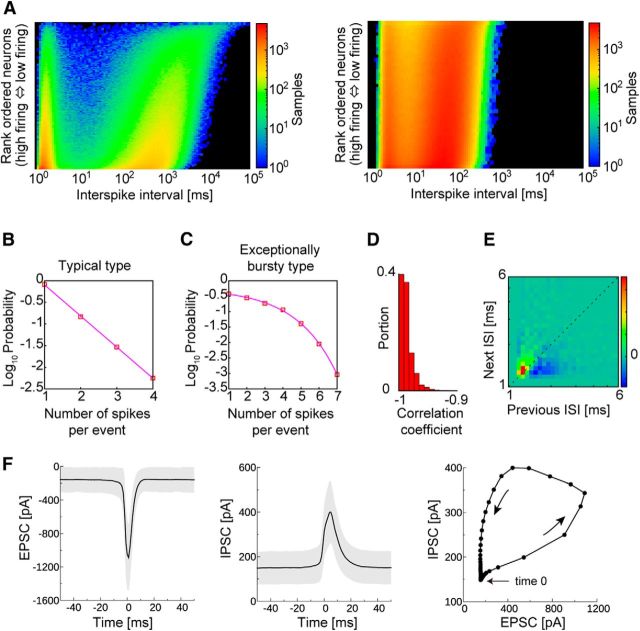
Figure 2.
Spike bursts in individual excitatory neurons. A, ISI distributions of excitatory (left) and inhibitory (right) neuronal populations. Neurons are arranged in descending order of average firing rates. B, The probability of finding a given number of spikes in a burst is shown for a typical excitatory neuron and for an exceptionally bursty neuron in C. D, The proportions of excitatory neurons with a given correlation coefficient between the bursting probability and burst length. E, Recursive map for intervals between successive bursts. F, Time courses for EPSCs (left) and IPSCs (middle) evoked in an excitatory neuron during bursts. The averaged time courses (solid lines) and SDs (gray shading) calculated from 200 bursts. Time 0 indicates the time at which the postsynaptic neuron fires. The trajectory of EPSCs and IPSCs averaged over 20 neurons is shown on the right.

