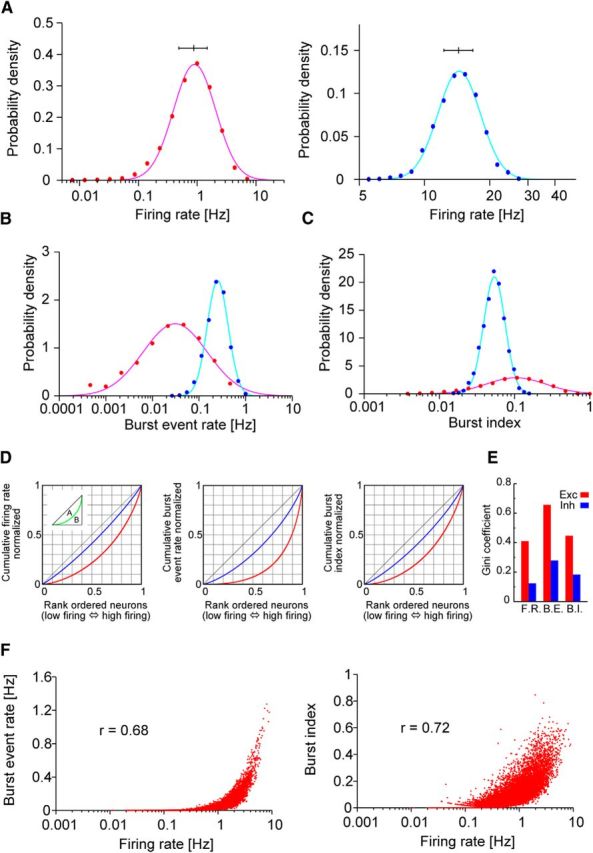
Figure 3.

Skewed distributions of neural activity indices. A–C, Distributions of firing rates, burst-event rates, and burst indices are shown for excitatory (red) and inhibitory neurons (blue). Here, burst is defined as a series of three or more spikes with <6 ms ISIs (Mizuseki and Buzsáki, 2013). The distributions display clear lognormal profiles for excitatory neurons. A, Horizontal bars above the distributions indicate the medians for the first and third quartiles. D, Lorenz plots of the above distributions, from which the Gini coefficient is calculated as A/(A + B) (inset). E, Gini coefficients for firing rates, burst-event rates, and burst indices. F, Burst-event rates (left) and burst indices (right) are positively correlated with logarithms of the firing rate.
