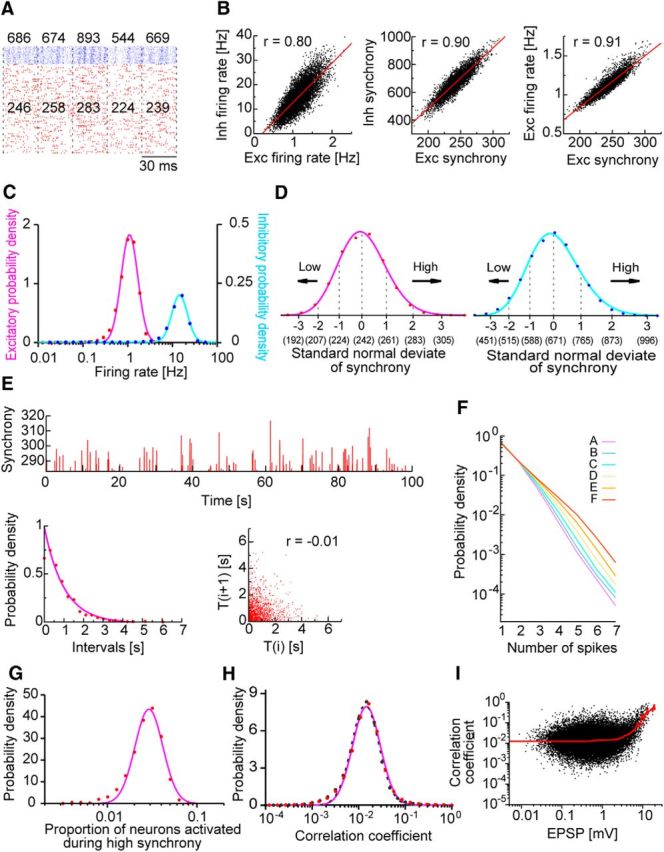
Figure 4.

Population synchrony in the lognormal network model. A, Population synchrony is schematically illustrated. Numbers in the raster plot show the excitatory (red) and inhibitory (blue) neurons that fire in successive time windows with a width of 30 ms; these numbers define the magnitude of synchrony in the corresponding time windows. B, Temporal fluctuations in firing rates (left) and the magnitude of synchrony (middle) are positively correlated between pools of excitatory (Exc) and inhibitory (Inh) neurons. Synchrony magnitudes are also positively correlated with firing rates (right). C, Distributions of the long-term averages of population firing rates are shown for excitatory and inhibitory neurons. D, The distributions of the synchrony magnitude × for the two neuron types are fitted by lognormal functions. The x-axis is divided into six segments by the standard normal variable as x = exp(μ + σ × Z), where μ = 5.490 (6.508) and σ = 0.077 (0.132) for excitatory (inhibitory) neurons. We categorized the degree of synchrony for the entire spike train of each neuron and averaged the resultant distribution over all neurons in the network. Numbers in parentheses indicate the magnitude of synchrony. The abscissa is given in a linear scale. E, Magnitudes of successive highly synchronous events are shown (top). A highly synchronous event is defined as an event in which the magnitude of the excitatory synchrony is greater than two standard normal deviates. The histogram of intervals between successive highly synchronous events is well fitted with an exponential function (bottom left). Their recursive plots exhibit a negative correlation (bottom right). F, The probability that a firing event of excitatory neurons contains a given number of spikes is plotted for different ranks of population synchrony. G, The proportion of excitatory neurons that fire at least once during a highly synchronous event is distributed lognormally over repeated events. We counted how many of the randomly chosen 250 ± 50 neurons fired in a highly synchronous event. We repeated this procedure while changing the neuron set and time window and took the average of the resultant distributions. H, The lognormal distribution of correlation coefficients is obtained for monosynaptically connected excitatory neuron pairs (red dashed), disconnected pairs (black dashed), and all the pairs (magenta). A small number of connected neuron pairs showed weak negative correlations. I, Correlation coefficients and their means (red) are plotted against average EPSP amplitudes.
