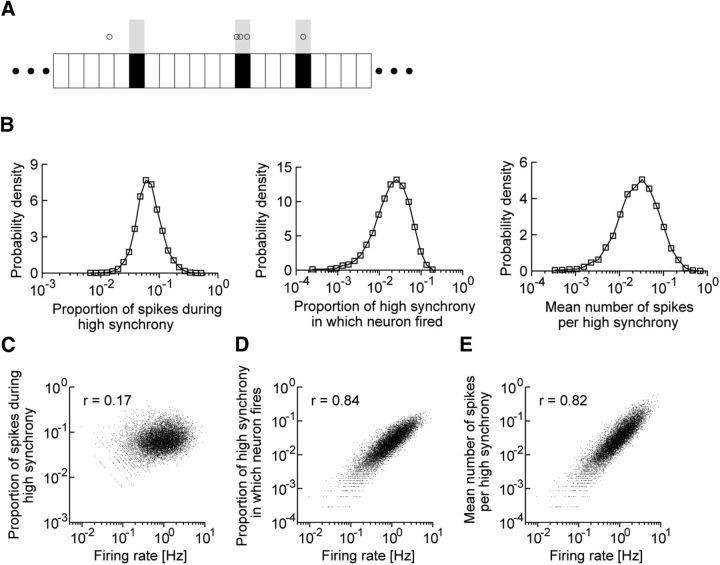
Figure 5.
Activity patterns of individual excitatory neurons during highly synchronous events. A, Schematic illustration of the activity indices analyzed below. Shaded time windows represent highly synchronous events. Empty circles represent spikes of a neuron. In this example, the proportion of spikes during high synchrony is 4 spikes/5 spikes, the proportion of highly synchronous events in which the neuron fires is 2 events/3 events, and the mean number of spikes per highly synchronous event is 4 spikes/3 events. B, The distributions of the above three indices during highly synchronous events are approximately lognormal. C–E, The values of three indices are correlated with the firing rates.

