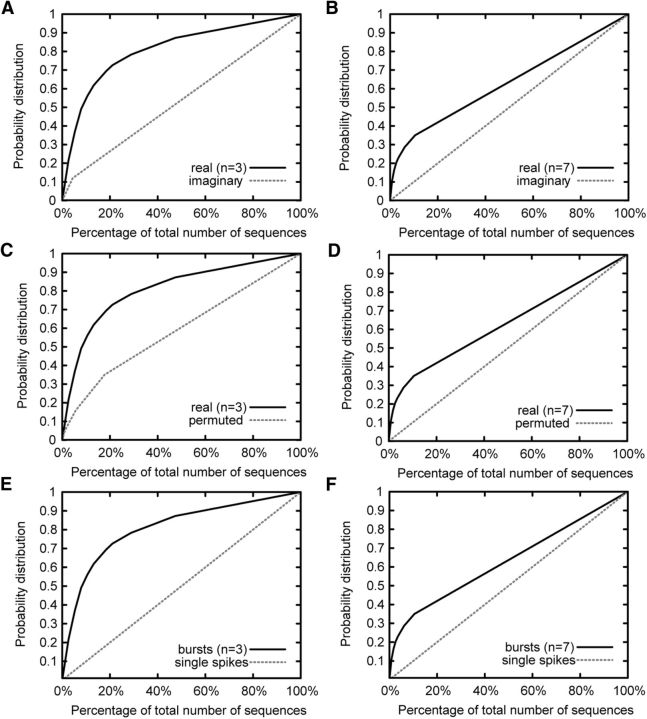
Figure 8.
Statistical tests for sequences following bursts of a highly bursty neuron. The cumulative distributions are shown for actual sequences (solid) and various control groups (dashed), which include imaginary (A, B), permuted (C, D), and single-spike-following sequences (E, F) with lengths 3 and 7, respectively.

