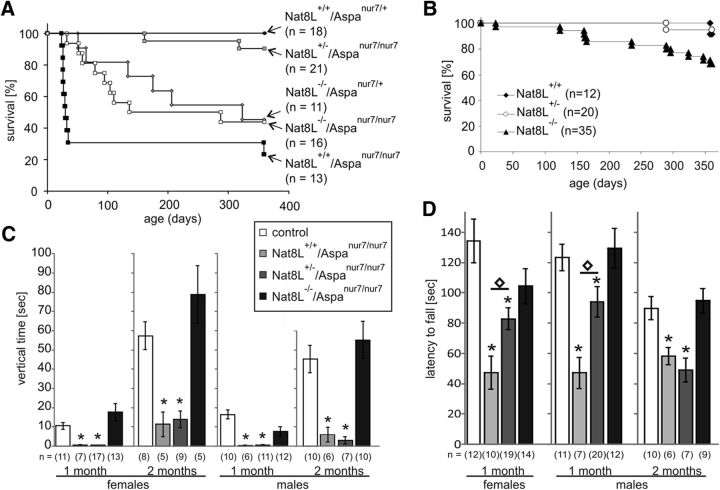
Figure 3.
Nat8L−/−/Aspanur7/nur7 mice have normal motor coordination capabilities, but survival time is not improved compared with Nat8L+/+/Aspanur7/nur7 mice. A, Kaplan–Meier plots revealing that the survival of Aspanur7/nur7 mice is strongly increased when they are heterozygous for the Nat8L gene (Nat8L+/−/Aspanur7/nur7). There was no significant difference between these and Nat8L+/+/Aspanur7/+ mice (log-rank test, p > 0.05). Mortality of Nat8L−/−/Aspanur7/nur7 mice was comparable to that of Nat8L−/−/Aspanur7/+ mice, indicating that premature death was not caused by NAA accumulation. Nevertheless, survival times of these mice were not significantly different from that of Nat8L+/+/Aspanur7/nur7 mice (log-rank test, p > 0.05). B, Kaplan–Meier plots showing increased lethality of Nat8L−/− mice. Approximately 30% of the Nat8L−/− mice died suddenly within 1 year without any preceding signs of sickness or abnormal behavior. Differences in survival time between Nat8L−/−/Aspanur7/+ (A) and Nat8L−/−/Aspa+/+ mice (B) might be due to differences in the genetic background. C, Rearing activity (vertical time during the 20 min test session) measured in the open field test. The test was performed with male and female mice of the indicated genotypes at 1 and 2 months of age. Data shown are the mean ± SEM (the number of animals analyzed is given below each column). Asterisks indicate statistically significant differences compared with Nat8L+/+/Aspanur7/+ mice (ANOVA with post hoc Bonferroni test; *p < 0.05). There was no significant difference between Nat8L+/−/Aspanur7/nur7 and Nat8L+/+/Aspanur7/nur7 mice. D, To examine motor coordination capability, accelerating rotarod tests were performed at 1 and 2 months of age with mice of the indicated genotypes. Latency to fall was significantly reduced in Nat8L+/−/Aspanur7/nur7 and Nat8L+/+/Aspanur7/nur7 mice compared with controls. Asterisks indicate significant differences from controls (Nat8L+/+/Aspanur7/+) (*p < 0.05, t test). Diamonds indicate significant differences between Nat8L+/−/Aspanur7/nur7 and Nat8L+/+/Aspanur7/nur7 mice. Data shown are the mean ± SEM (the number of animals analyzed is given below each column).

