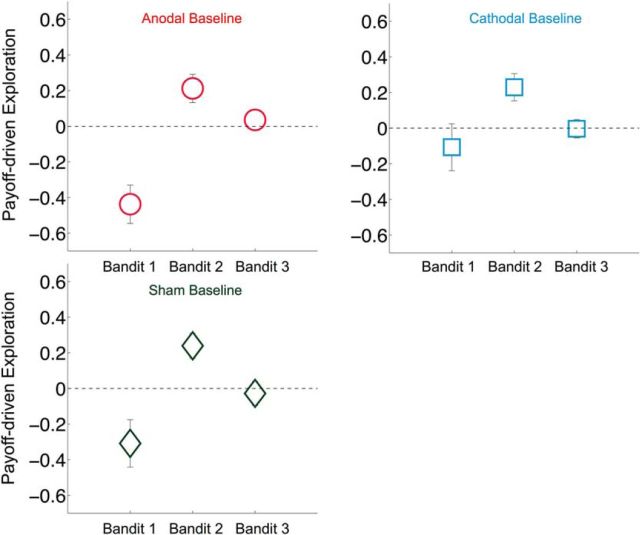
Figure 3.
Payoff-driven exploration during baseline. During the baseline before stimulation, the rewards of the slot machines influenced participants' decisions to explore or exploit similarly across all three groups. The y-axis represents standardized β values from a logistic regression of decisions (explore vs exploit on estimated slot machine rewards). Positive β values indicate that the participant was more likely to explore with higher estimated rewards of the slot machine. Negative β values indicate that the participant was more likely to exploit with higher estimated rewards of the slot machine. There was a significant main effect of the reward-based rank of the slot machines on the probability to explore or exploit. Participants in all three groups were more likely to exploit if the value of the highest-paying slot machine was greater and more likely to explore if the value of the second highest-paying slot machine was greater. Bandit 1, Bandit 2, and Bandit 3 refer to a trial-wise ranking of the bandits estimated to yield the highest (1) to lowest (3) payoff. Error bars indicate SEM.

