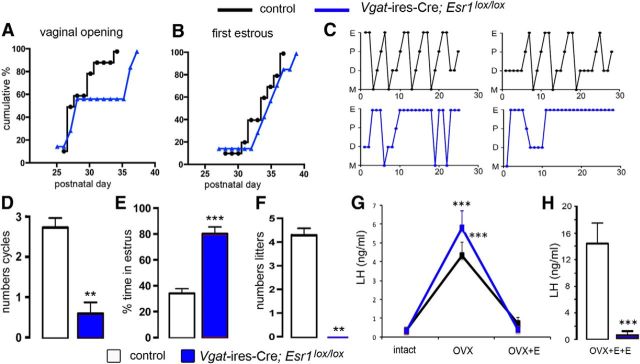
Figure 4.
Reproductive profile of Vgat-ires-Cre;Esr1lox/lox mice. A, B, Puberty onset for control (black, n = 16) and mutant (blue, n = 7) mice displayed as cumulative percentage charts for vaginal opening (A) and first estrous (B). C, Representative adult estrous cycle profiles for two control (top) and two mutant (below) mice. D, E, Histograms showing the mean ± SEM number of complete estrous cycles (D) and percentage time spent in estrous (E) in control (n = 20) and mutant Vgat-ires-Cre;Esr1lox/lox (n = 9) mice. **p < 0.01, ***p < 0.001 (Mann–Whitney U tests). F, Histogram showing the mean ± SEM number of litters born to control (n = 5) and mutant (n = 5) female mice over a 3 month mating period. **p < 0.01 (Mann–Whitney U tests). G, Estrogen negative feedback in control (black, n = 7) and mutant (blue, n = 6) mice showing mean ± SEM changes in LH secretion after OVX and OVX+E. ***p < 0.01 versus intact and OVX+E (repeated-measures ANOVA with Bonferroni post hoc tests). H, Positive feedback mean ± SEM levels of LH in ovariectomized control (n = 7) and mutant (n = 6) mice treated with estradiol (OVX+E+E) to evoke the GnRH/LH surge. ***p < 0.001 (Mann–Whitney U test).

