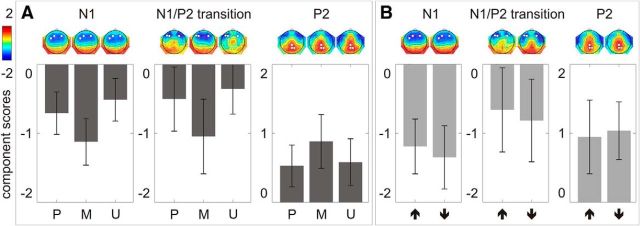
Figure 4.
The N1, N1/P2 transition, and P2 component scores averaged across three electrodes showing the largest response (marked as white dots on the component score topographies) in each condition. A, In the main experiment, comparisons between predicted (P), mispredicted (M), and unpredicted (U) conditions are illustrated. B, In the control experiment, comparisons between one-natural-key-higher (upward arrow) and four-natural-key-lower (downward arrow) conditions are illustrated. Error bars depict one SD of the mean.

