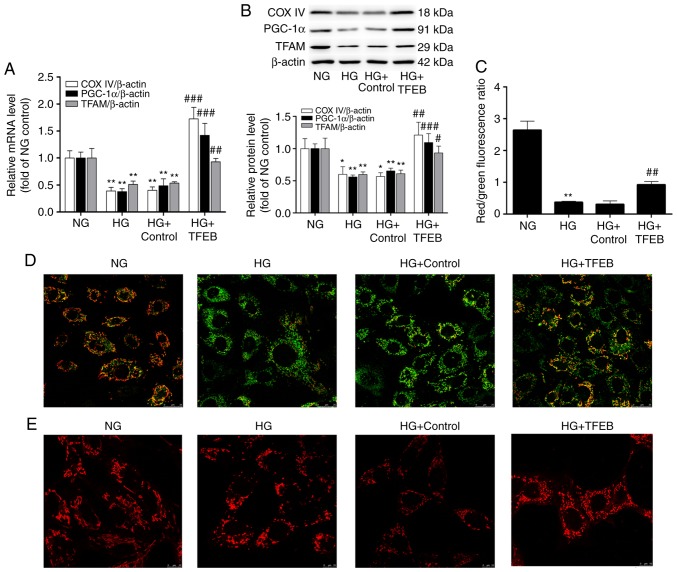
Figure 3.
Overexpression of TFEB can maintain mitochondrial morphology and function. The HG + TFEB group transfected with the TFEB expression vector and the HG + control group transfected with an empty plasmid vector were cultured in HG medium for 48 h. Then, (A) mRNA and (B) protein levels of PGC-1α, TFAM and COX IV were detected by reverse transcription-quantitative polymerase chain reaction and western blot analysis. (C) The red fluorescence/green fluorescence ratio indicates the change in mitochondrial membrane potential. (D) Detection of mitochondrial morphology by confocal microscopy. Scale bar=10 µm ; Magnification, ×630. (E) Change of mitochondrial membrane potential of podocytes detected by confocal microscopy. Scale bar=25 µm; Magnification, ×630. *P<0.05, **P<0.01 vs. NG group. #P<0.05, ##P<0.01, ###P<0.001 vs. HG + Control group. TFEB, transcription factor EB; HG, high glucose; PGC-1α, peroxisome proliferator-activated receptor-γ coactivator-1α; TFAM, transcription factor mitochondrial; COX IV, cytochrome c oxidase subunit IV; NG, normal glucose.

