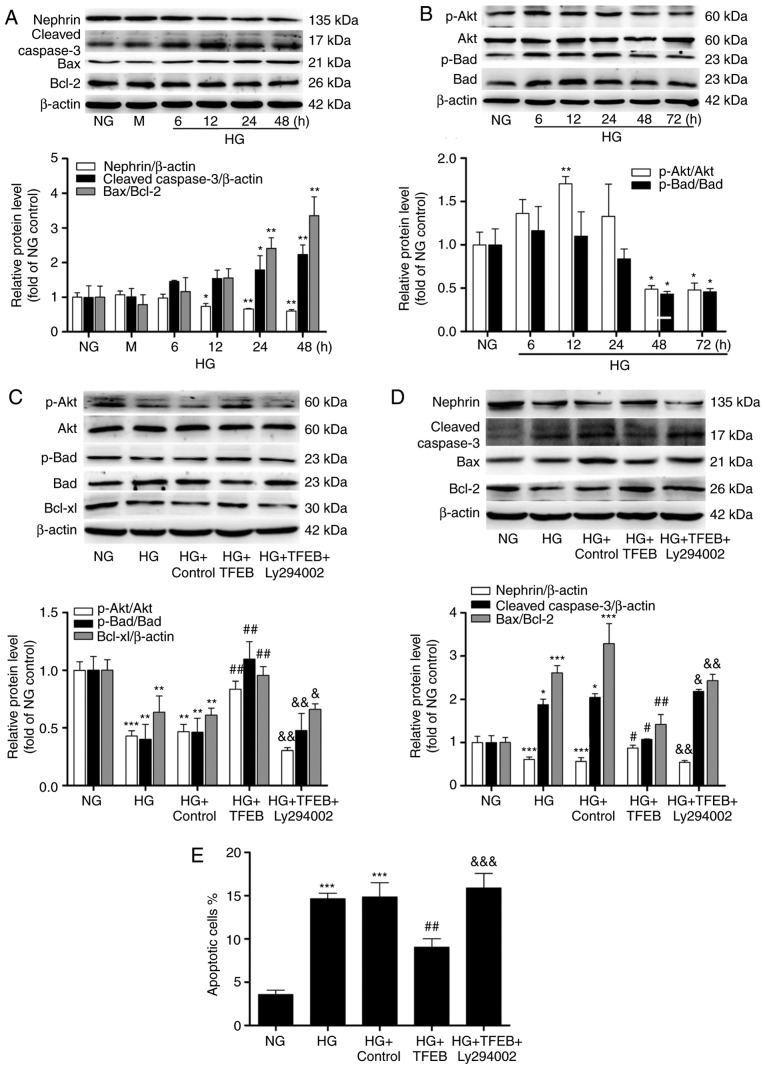
Figure 4.
Effects of TFEB overexpression on podocyte apoptosis and the Akt/Bad pathway. (A) The expression levels of nephrin, cleaved-caspase-3 and Bax/Bcl-2 in podocytes exposed to HG at different time points were analyzed by western blot. (B) The expression levels of p-Akt, Akt, p-Bad, Bad and downstream Bcl-xl were detected by western blot. (C) p-Akt, AKT, p-Bad, Bad and Bcl-xl protein expression in the NG, HG, HG + Control, HG + TFEB and HG + TFEB + Ly294002 groups. (D) Nephrin, cleaved-caspase-3, Bax and Bcl-2 protein expression in the NG, HG, HG + Control, HG + TFEB and HG + TFEB + Ly294002 groups. (E) Flow cytometry was used to detect the apoptosis rate of each group when podocytes were exposed to HG for 48 h after overexpression of TFEB. *P<0.05, **P<0.01, ***P<0.001 vs. NG group. #P<0.05, ##P<0.01 vs. HG + Control group. &P<0.05, &&P<0.01, &&&<0.001 vs. HG + TFEB group. TFEB, transcription factor EB; HG, high glucose; p, phosphorylated; NG, normal glucose; M, mannitol-hypertonic control.

