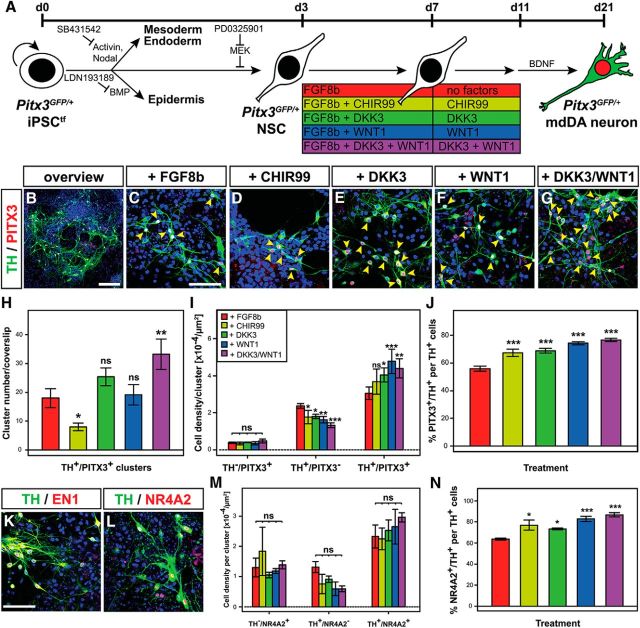
Figure 6.
Combined DKK3/WNT1 treatment generates the highest proportion of TH+/PITX3+ and TH+/NR4A2+ mdDA neurons from differentiating murine iPSCs. A, Scheme of the monolayer protocol for the differentiation of Pitx3GFP/+ iPSCtfs into mdDA neurons. B–G, Representative confocal overview (B) and close-up views (C–G) of TH+ (green) and PITX3+ (red) cells (yellow arrowheads) after treatment of differentiating Pitx3GFP/+ iPSCtfs with FGF8b alone (C) or together with CHIR99 (D), DKK3 (E), WNT1 (F), or DKK3 + WNT1 (B, G). H, I, Quantification of TH+/PITX3+ double-positive cell clusters per coverslip (H) and TH/PITX3 single- and double-positive cell densities within these clusters (I) after treatment of differentiating Pitx3GFP/+ iPSCtfs with different factor combinations (n = 5 experiments/condition). J, Quantification of the proportion of PITX3+/TH+ double-positive cells among all TH+ cells in these cultures (n = 3 experiments/condition). K, L, Representative confocal close-up views of TH+ (green)/EN1+ (red) (K) and TH+ (green)/NR4A2+ (red) (L) cells after treatment of differentiating Pitx3GFP/+ iPSCtfs with DKK3 + WNT1. M, N, Quantification of TH/NR4A2 single- and double-positive cell densities within clusters (M) and the proportion of NR4A2+/TH+ double-positive cells among all TH+ cells (N) after treatment of differentiating Pitx3GFP/+ iPSCtfs with different factor combinations (n = 3 experiments/condition). Color coding of bars in H–J, M, and N as indicated in the scheme in A; statistical testing for significance in H–J, M, and N was always done in relation to the untreated (only FGF8b-treated) cells. *p < 0.05; **p < 0.005; ***p < 0.001; ns, not significant in one-way (H, J, N) or two-way (I, M) ANOVA relative to the FGF8b-treated cells. Scale bars: B, 100 μm; C, K, 50 μm.

