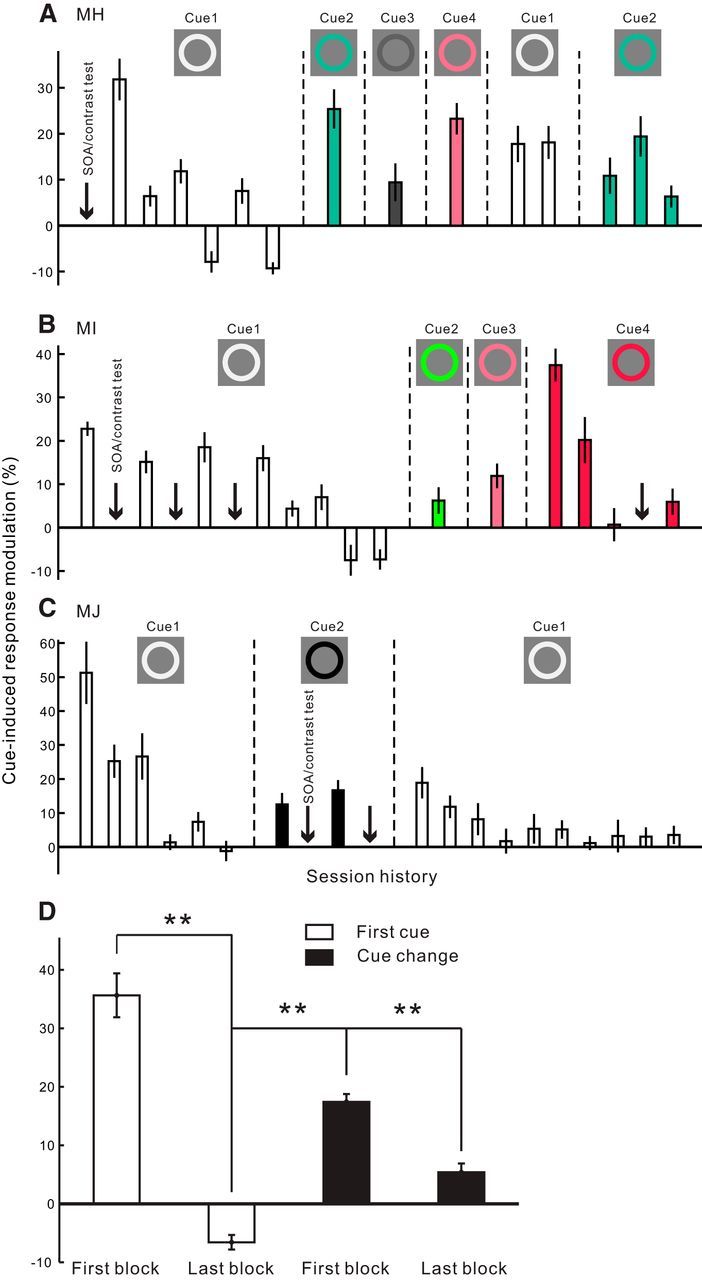
Figure 6.

Dependence of the cueing effect in V1 on the novelty of the cue in the fixation task. A–C, Session history showing the effect of repeated exposure of the same cue and the effect of cue replacements in 3 animals, respectively. Each bar represents the cue-induced modulation in V1 within a small block of probing trials (40–60 cue-on and cue-away trials, respectively, for Monkey MH; 50 trials for Monkeys MI and MJ). From left to right, the bars are arranged in a chronological sequence. Within each group of bars bounded by vertical dashed lines, the cue settings were identical during the experiments. The colors of the cue are illustrated in the insets; the cue-to-probe SOA was 150 ms. Because of an arbitrary placement of the cue and probe in different recording sessions (refer to Fig. 1B), the number of recording sites varied slightly for each bar (n = 22–33 in Monkey MH, 13–20 in Monkey MI, 15–23 in Monkey MJ). Downward arrows in each plot indicate the time points where recording sessions were inserted to examine the effects of SOA and stimulus contrast (data shown in Figs. 4, 5). D, Averaged results across the 3 animals, showing the mean cueing effects in the first and last blocks of probing trials when the very first cue was used (two empty bars, n = 69 and n = 61, respectively; corresponding to the first and last bar in the left group of empty bars shown in A–C); in the first block of probing trials whenever the cue was changed (first black bar, n = 223; corresponding to every first bar after a cue change in A–C); and at the end of the experiments (second black bar, n = 57; corresponding to the very last bar in A–C). Error bars indicate ± SEM across recording sites. **p < 10−7 (two-sided t test).
